Information Technology Reference
In-Depth Information
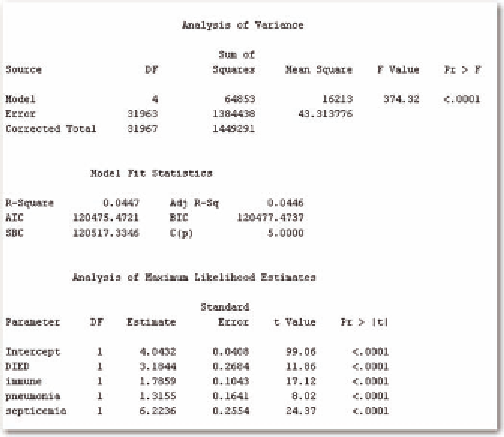
Figure 20. Regression results for length of stay
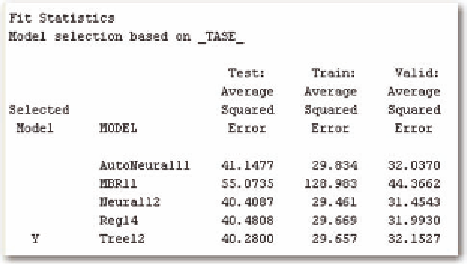
Figure 21. Results of predictive modeling for length of stay with a 0.5% sample
Figure 21 shows the results limited to just 1000 random observations. The average squared error is
slightly smaller (Figure 22). Otherwise, the decision tree remains the best model, with regression having
just a slightly larger error rate.
The regression model increases the r
2
slightly to 0.06; however, not all of the variables are statisti-
cally significant with this small dataset (Figure 23).
Note that mortality, immune disorder, and pneumonia are no longer statistically significant. The
remaining significant variable is septicemia. This result again demonstrates that a sample that is too
large will indicate that all variables are statistically significant, but with an r
2
that is so low as to make
the model meaningless. Reflecting that smaller sample size and lack of significance in the model, the
decision tree is simpler as well (Figure 24); pneumonia is not used at all in the tree.
We can also include the interactions in the model, to include consideration of patients with 2 or 3 of
the diseases we are using in the model. However, that change does not alter the results terribly much. We
Search WWH ::

Custom Search