Information Technology Reference
In-Depth Information
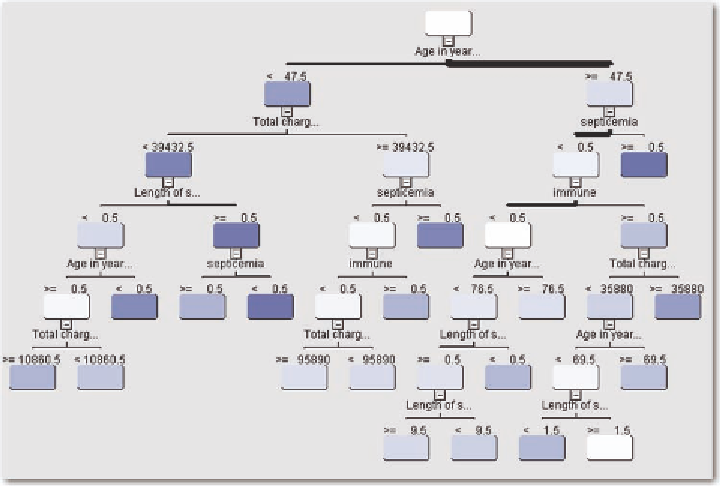
Figure 8. Decision tree variables
This tree shows that age, length of stay, having septicemia, immune disorder, length of stay and total
charges are related to mortality. The remaining variables have been rejected from the model. The rule
induction is the best model, and the misclassification rate decreases to 22% with the added variables.
The ROC curve looks considerably improved (Figure 9).
The ROC curve is much higher compared to that in Figure 6. If we use regression to perform the
variable selection, the results remain the same. In addition, a decision tree is virtually the same when it
follows the regression compared to when it precedes regression (Figure 10).
The above example only used three possible diagnosis codes. We want to expand upon the number
of diagnosis codes, and also to use a number of procedure codes. In this example, we restrict our atten-
Figure 9. ROC curves for models following decision tree

Search WWH ::

Custom Search