Information Technology Reference
In-Depth Information
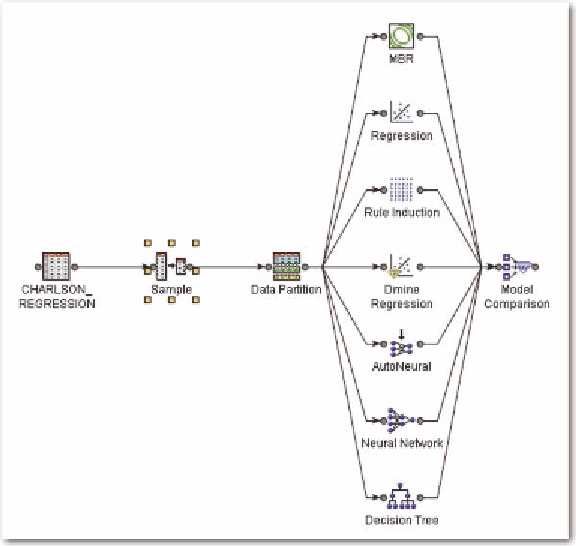
Figure 3. Addition of sampling node
interval independent variables. There is one remaining model in Figure 3; the MBR or memory-based
reasoning model. It represents nearest neighbor discriminant analysis. We first discuss the use of the
sampling node in the process of predictive modeling. We start with the defaults for sampling node as
modified in Figure 4.
The first arrow indicates that the sampling is stratified, and the criterion is level based. The rarest
level (in this case, mortality) is sampled so that it will consist of half (50% sample proportion) of the
sample to be used in the predictive model.
We consider the same problem of predicting mortality that was discussed in the previous chapter.
We use just the three patient diagnoses of pneumonia, septicemia, and immune disorder that we used
in Chapter 3. However, unlike the analysis in Chapter 3, we use the sampling node to get a 50/50 split
in the data.
We use all of the models depicted in Figure 1. According to the model comparison, the rule induc-
tion provides the best fit, using the misclassification criterion as the measure of “best”. We first look at
the regression model, comparing the results to those in the previous chapter when a 50/50 split was not
performed. The overall misclassification rate is 28%, with the divisions as shown in Table 1.
The misclassification becomes more balanced between false positives and false negatives with a
50/50 split in the data. The model gives heavier weight to false positives than it does to false negatives.
We will clearly demonstrate the benefits of a 50/50 split in Chapter 5, as we discuss some of the severity
indices currently available.
We will first consider the example used in Chapter 3 with just three diagnoses of pneumonia, septi-
cemia, and immune disorder. We will contrast the predictive modeling approach here to the regression
Search WWH ::

Custom Search