Information Technology Reference
In-Depth Information
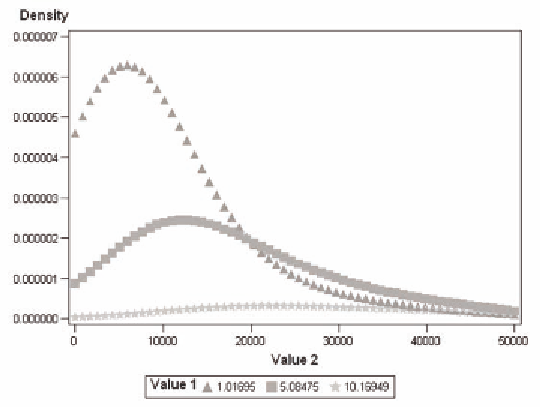
Figure 14. Cross sectional kernel density for 1,5, and 10 days
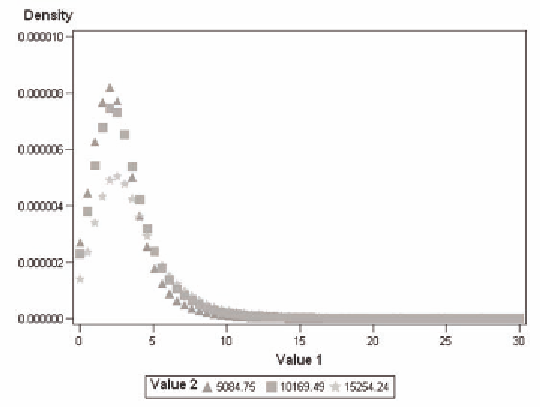
Figure 15. Length of stay for total costs of $5000, $10,000, and $15,000
Similarly, Figure 16 shows the length of stay for charges of $20,000, $25,000, and $30,000. The peak
remains at 2.5 days. Because the charges are so variable for a length of stay of 2.5 days, a regression of
length of stay to charges will continue to have a low r
2
value. The only way to increase it is to include
more variables in the model.
We add more variables when examining mortality in relationship to the example of cardiovascular
surgery. This model is 88% accurate even though less than 2% of the patients die in the hospital. How-
ever, almost all of the deaths are classified as non-mortality while the false positive rate is somewhat
high. We will discuss this example in more detail in Chapter 4.
Search WWH ::

Custom Search