Information Technology Reference
In-Depth Information
discernable pattern if the assumptions on the residuals are satisfied. In addition, we examine the r
2
value,
which explains the proportion of the variability of Y that can be explained by the variability in X. In
this regression, the r
2
value is 47%, indicating that over half of the variability in total charges remains
unexplained.
It is quite clear that the assumptions on the residuals are not satisfied since there is a fan-shaped pat-
tern in Figure 11. When that occurs, it is possible to perform a transformation on the variables to see if
the transformation will cause the assumptions to be satisfied. When the residuals have this fan shape,
one possible transformation is a log function. We can consider the log of total charges, or the log of
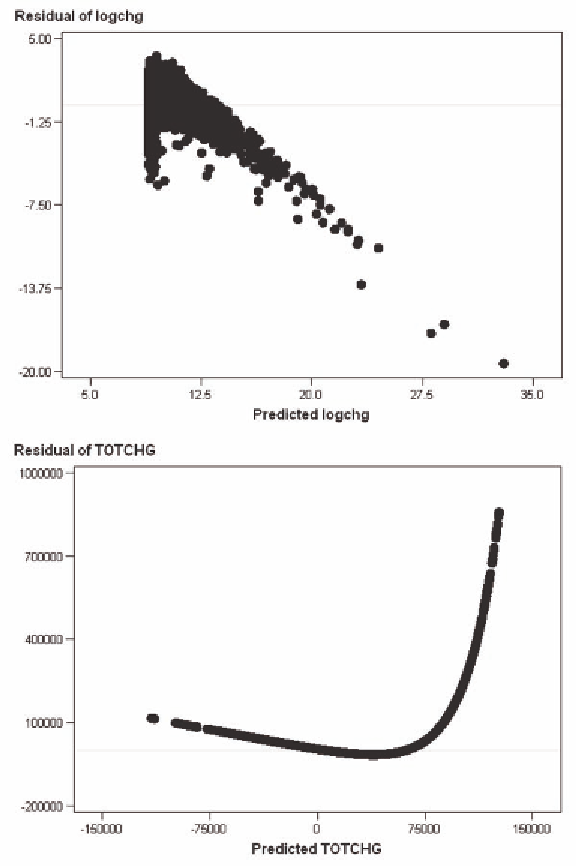
length of stay. The top of Figure 12 gives the residuals for a log of the length of stay, with an r
2
of 44%;
the bottom gives the residuals for a log of total charges, with an r
2
of 26%.
Figure 12. Residuals for log of length of stay (top); residuals for log of total charges (bottom)
Search WWH ::

Custom Search