Environmental Engineering Reference
In-Depth Information
(a)
MANTLE FRAME
60°N
SBT
CRB
Perm
Castle 0.9%
30°N
Jason
I
min
SMEAN 1%
Jason
Tuzo
30°S
96
60°S
Fig. 1 (Torsvik & Burke 2014)
Vs (%)
-1.0
0
1.0
2.5
-2.5
MANTLE FRAME
(b)
SBT
60°N
CRB
Perm
30°N
Jason
Jason
Tuzo
30°S
60°S
5
3
1
0
Cluster analysis (1000-2800 km)
1% slow contour SMEAN (2800 km)
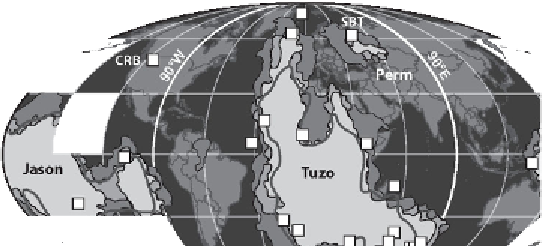
Figure 3.2 (a) Reconstructed LIPs (
Figure 3.1
) superimposed on the SMEAN
tomographic model (Becker & Boschi,
2002
) at 2800 km depth (
V
s
is S-wave
anomaly). LIPs are reconstructed using a moving hotspot frame (black squares) or
a TPW-corrected palaeomagnetic frame (white squares) before 125 Ma (see text).
We also show the 1% slow contour in this model (SMEAN 1%) that we have
extensively used as the proxy for the plume generation zones (Torsvik
et al
.,
2006
) as well as the 0.9% slow contour in the S-SKS Castle
et al
.(
2000
) model
(Burke
et al
.,
2008
). CRB, Columbia River Basalts; SBT, Siberian Traps. The
African and Paci
δ
c LLSVPs are dubbed the Tuzo and Jason provinces. Columbia
River Basalts (CRB) and the Siberian Traps (SBT) are not directly correlated with
the edges of Tuzo and Jason but to smaller anomalies in the lowermost mantle
beneath regions such as Perm (Lekic
et al
.,
2012
). The mean axis (0
N, 11
E) for
Mesozoic TPW is marked by a white circle (
I
min
) and approximates the longitude
of minimum moment of inertia associated with Tuzo and Jason. (b) Reconstructed
LIPs as in
Figure 3.2a
but shown together with seismic voting-map contours
(Lekic
et al
.,
2012
). Contours 5
ne the LLSVPs and 0 (blue) denotes faster
regions in the lower mantle. The 1% slow SMEAN contour is shown for com-
parison. A black and white version of this
-
1de
figure will appear in some formats.
For