Environmental Engineering Reference
In-Depth Information
(a)
(b)
(c)
3
¥
10
4
4
11000
3
10000
2.5
2
9000
2
1
8000
0
1.5
7000
−1
6000
1
−2
5000
−3
0.5
4000
−4
0
3000
−5
−6
−0.5
2000
−60
−40
−20
0
20
40
60
−60
−40
−20
0
20
40
60
−60
−40
−20
0
20
40
60
Time from onset of the extinction (kyr)
(d)
(e)
(f)
27
5.5
7.6
5
26
7.5
4.5
25
7.4
4
24
7.3
3.5
23
7.2
3
22
7.1
2.5
21
2
7
−60
−40
−20
0
20
40
60
−60
−40
−20
0
20
40
60
−60
−40
−20
0
20
40
60
Time from onset of the extinction (kyr)
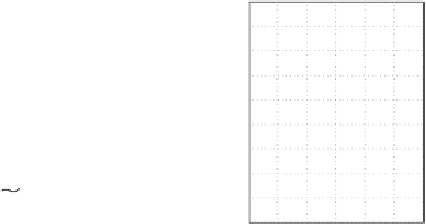
Figure 19.3 Time-series of environmental parameters for our favorite scenario
(
13
C
flux of C; (b) total amount of
C released; (c) atmospheric
p
CO
2
; (d) Global average sea surface temperature
(
C);
Ω
calcite
¼
5,
δ
¼ -
25
‰
),
including (a)
(e) Sea-surface saturation state of calcite;
(f) Global average ocean
surface pH.
Higher initial
flux and amount of C added, as well as
higher peak
p
CO
2
and sea-surface temperature (
Figures 19.4a
Ω
calcite
values yield higher peak
calcite
of the
ocean surface is most sensitive to initial saturation state for the smaller perturbation
associated with methane release; the initial buffering capacity is more rapidly
overwhelmed for larger perturbations (
Figures 19.4e
,
f
).
-
d
).
Ω
19.3.2 Surface
Ω
calcite
and ocean-saturation-horizon response
To evaluate the spatial pattern of ocean-surface acidi
cation, we show the map
view of
Ω
calcite
during peak C addition (
~
10 kyr after the onset of extinction)
for four selected scenarios (
Figure 19.5a
high-latitude regions had lower saturation states (
Figure 19.5a
-
c
), but no under-
saturation is observed for the three prescribed initial saturation states. Under
elevated
p
CO
2
(
Figure 19.5d
-
-
o
), the high latitudes tend to become undersaturated