Environmental Engineering Reference
In-Depth Information
60
(a)
40
20
0
-20
-40
13
C = -9‰
13
C = -25‰
d
d
-60
d
13
C = -12‰
13
C = -40‰
-80
d
d
13
C = -15‰
60
13
C = -60‰
d
(b)
d
13
C = -20‰
40
20
0
-20
-40
-60
-80
60
(c)
40
20
0
-20
-40
-60
-80
(d)
1
0.5
0
-0.5
(e)
1
0.5
0
-0.5
1
(f)
0.5
0
-0.5
-
60
-40
-20
0
20
40
60
Time from onset of the extinction (kyr)
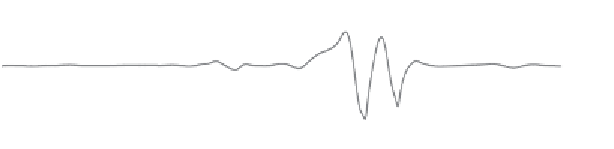
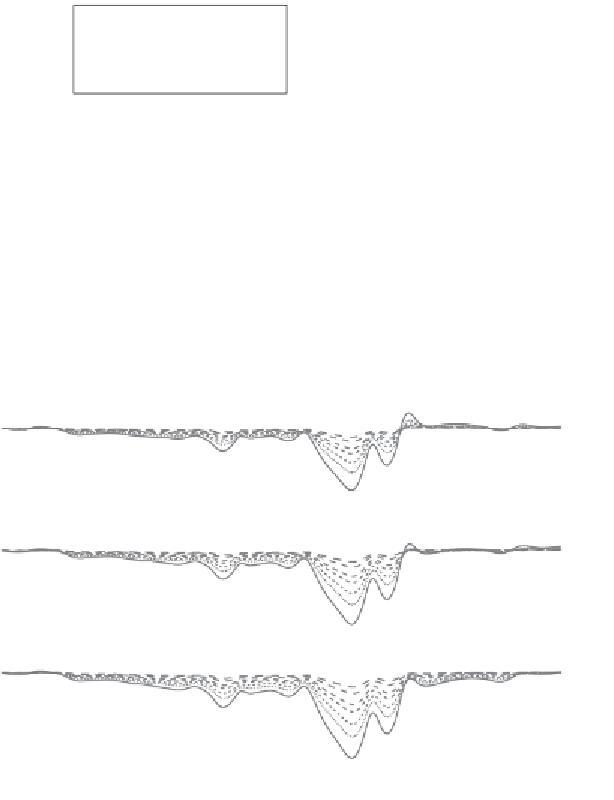
Figure 19.2 Time-series plot of carbon emission
fluxes for the 21 experiments
(a,
10), and the log function of
the surface ocean saturation state for the 21 experiments (d,
Ω
calcite, init
¼
2.5; b,
Ω
calcite, init
¼
5; c,
Ω
calcite, init
¼
Ω
calcite, init
¼
2.5; e,
Ω
calcite, init
¼
5; f,
Ω
calcite, init
¼
10).