Environmental Engineering Reference
In-Depth Information
4
3.3
3
2.3
2
1.3
1
0.3
0
−0.7
−1
−1.7
−2
−2.7
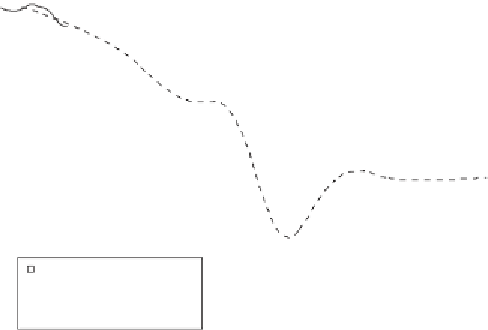
Raw data from Shen et al., 2011
“Loess” fit from Cui et al., 2013
“Loess” fit in this study
−3
−3.7
−4
−4.7
−60
−40
−20
0
20
40
60
Time from onset of the extinction (kyr)
13
C value of carbonate from Shen
et al
.(
2011
) (squares), the
Figure 19.1
δ
13
C in this study (solid line) and the
statistical
“
loess
”
t to the
δ
“
loess
”
tin
13
C value of
Cui
et al
., (
2013
) (dotted line); the right
y
-axis gives the inferred
δ
DIC used to force the model.
biogenic methane (
). We conducted 21 runs in total with three initial
saturation states and seven different sources (
Table 19.2
).
-
60
‰
19.3 Results
19.3.1 Flux and total amount of C addition, pCO
2
, ocean-surface
temperature,
Ω
calcite
and pH
The model results for peak
flux and total amount of C addition, peak
p
CO
2
, ocean-
surface temperature, and minimum
calcite
and pH are summarized in
Table 19.2
.
We show how two important environmental variables, the
Ω
flux of the C addition and
Ω
calcite,
change with time for various scenarios in
Figure 19.2
. The C release appears
to have come in two multimillennial-duration pulses, with the highest peak rate of
about 66 Gt C yr
-
1
10 Gt C yr
-
1
(cf. 9
-
13
scenario 1 (
δ
C
source
¼ -
9
‰
and
Ω
¼
10) and the lowest peak rate of about
calcite, init
0.7 Gt C yr
-
1
for scenario 21 (the scenario with
13
¼
2.5). More
13
C-depleted sources and lower initial saturation states cause dramatic
declines in modeled peak rates of C addition (
Figure 19.2a
δ
C
source
¼ -
60
‰
and
Ω
calcite, init
c
and
Table 19.2
). It is
also interesting to note that the two pulsed C-release events are followed by two C-
burial events, expressed as negative C
-
to reproduce the rapid rate of C isotope recovery from the minimum values. The total
ux (
Figure 19.2a
-