Environmental Engineering Reference
In-Depth Information
I
H
A
R
E
T
L
Greenland
(59-60Ma)
BTIP
Siberian Traps
(250Ma)
Central Atlantic
margin
(200Ma)
Emeishan
Basalts
(258Ma)
Ethiopian Traps
(30Ma)
Deccan Traps
(65Ma)
Ontong Java
120Ma
Parana Etendeka Traps
(131-133Ma)
Ferrar Volcanics,
Karoo Traps (184Ma)
Rajmahal (120Ma)
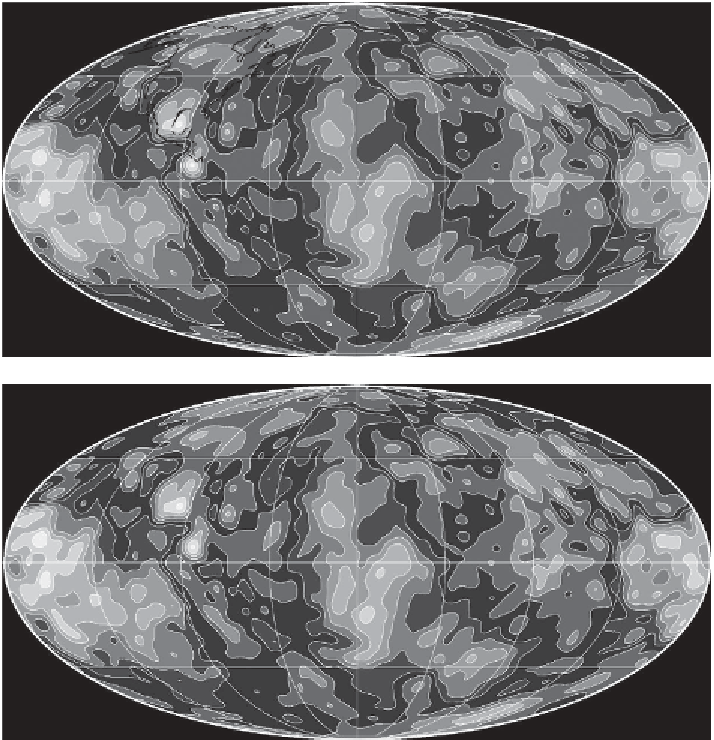
Figure 15.3 Seismic velocity anomalies near the core
-
mantle boundary (color
scale from
3% (slow) anomalies in shear velocity; Ritsema
et al
.,
2011
). (Top) Distribution of 49 hotspots from the catalog used in Courtillot
et al
.
(
2003
). The seven
þ
3% (fast) to
-
“
primary
”
hotspots are shown as downward-pointing triangles
(H
¼
Hawaii, E
¼
Easter Island, L
¼
Louisville, T
¼
Tristan da Cunha,
I
Reunion). Upward-pointing triangles are hotspots
with possible deep origin. Dots indicate other hotspots. (Bottom) Same distribu-
tion with locations of main
¼
Iceland, A
¼
Afar, R
¼
flood basalt provinces at appropriate locations at time
day outcrops of lava (in black) is indicated, with LIP name and age. See stability
of plume head and tail location in time near edges of slow quadrupolar anomalies.
A black and white version of this
figure will appear in some formats.
For the