Environmental Engineering Reference
In-Depth Information
Tp,
C
0
1600
1500
1400
1300
1200
1100
1000
900
800
700
600
200
400
600
km-500
0
500
1000
252.28
252.10
0
Age (Ma)
0
200
200
400
400
600
600
km-500
0
500
1000
km-500
0
500
1000
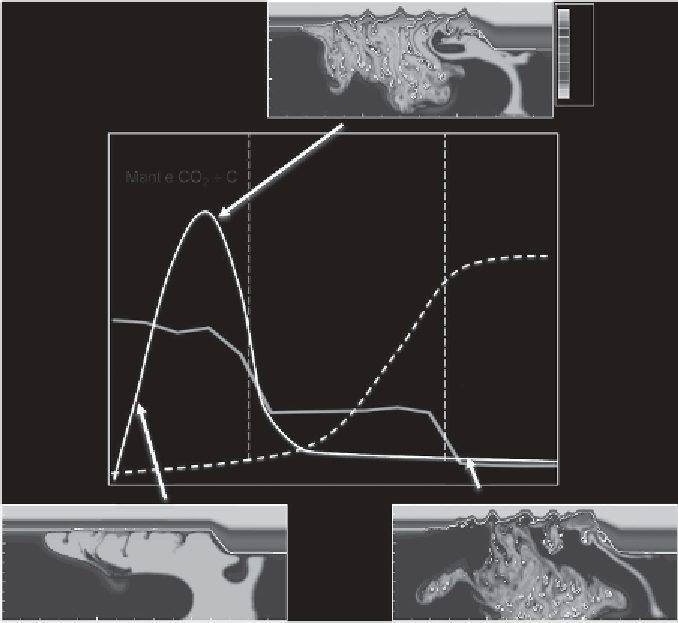
Figure 10.6 Model cartoon. The blue solid curve shows temporal evolution of
species richness near Permian
-
Triassic boundary with two pronounced extinction
events (Song
et al
.,
2012
). The black curves schematically show suggested
temporal evolution of magmatic (solid curve) and thermogenic (dashed curve)
volatile
fluxes. Colored cross-sections show snapshots of temperature distribution
in the Siberian mantle in the model by Sobolev
et al
.(
2011
) corresponding to
different stages of degassing. The most extensive degassing from the plume
occurs during the destruction of the mantle lithosphere by the plume, before the
main magmatic phase. A black and white version of this
figure will appear in
some formats.
For the colour version, please refer to the plate section
.
concentrations of CO
2
. At the middle and late stages the mantle source evolved
towards an increasing fraction of peridotite, and the pyroxenite component became
depleted in Cl and CO
2
. The initial pulse in the end-Permian mass extinction can
be linked to the release of magmatic CO
2
, Cl and other gases from this source.
2. Typical tholeiitic magmas of the Siberian LIP indicate a low amount of Cl of
magmatic origin; the Cl that some magmas contained was probably related to
the assimilation of sedimentary evaporites.