Environmental Engineering Reference
In-Depth Information
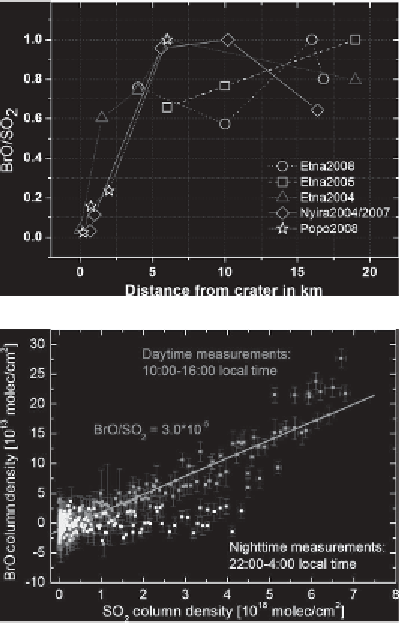
(a)
(b)
Figure 8.5
ratios (normalised) as a function of
distance from the crater for three volcanoes (Etna, Nyiragongo, Popocatepetl)
visited during 2004 and 2008 (after Bobrowski and Giuffrida,
2012
). (b) BrO/SO
2
ratios (based on column densities) during daytime and at night at Masaya volcano,
Nicaragua. Only during daytime BrO levels signi
(a) The evolution of BrO/SO
2
-
cantly exceed zero, thus
strongly indicating that BrO-formation is a photochemical process (from Kern
et al
.,
2009
).
See also colour plates section
.
plume level). An example in
Figure 8.5a
shows data from three volcanoes for
distances up to 18 km (
t
up to
30 minutes). While initially reactive bromine
abundances are very low, there appears to be a saturation level in the BrO/SO
2
ratio at distances
(3) BrO/SO
2
ratios
>
5km(
t
derived from cross sections through the volcanic plume of
Mt Etna by passive-imaging DOAS (Louban
et al
.,
2009
; General
et al.
,
-
are clearly higher at the plume edges than in the centre, again
indicating dependence of the bromine activation on species mixed into the
plume from the surrounding air.
-