Environmental Engineering Reference
In-Depth Information
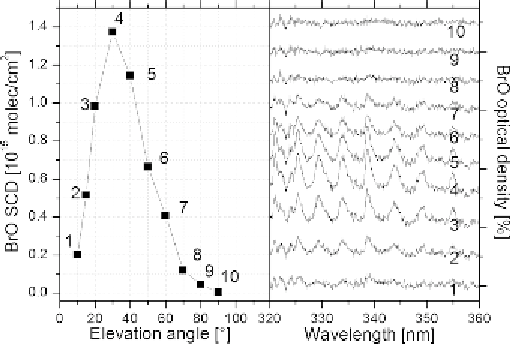
Figure 8.3 Example of DOAS plume scanning (see
Figure 8.2b
). Left panel:
cross section of the BrO column density in the plume of Soufrière Hills volcano
on Montserrat, May 2002. Right panel: BrO optical density spectra (
D
(
)) corres-
ponding to the observation; elevation angles are shown on the left (after
Bobrowski
et al
.,
2003
).
λ
From the above it becomes clear that remote sensing has a number of decisive
advantages over
in situ
observations:
(a) Under most conditions the total amount of gas in the plume can be determined,
rather than the gas concentration at the plume edge.
(b) Measurements can be made from distances of typically a few kilometres; thus,
remote sensing is much safer than
in situ
sampling.
(c) The technology allows for easy automation and thus continuous real-time
measurements even during periods of explosive activity.
It should also be kept in mind that spectroscopic techniques are fundamentally
different from the analysis schemes applied to
in situ
samples (see
Section 8.3.1
)in
that spectroscopic techniques identify individual molecules and are inherently
calibrated (with respect to the column density).
The different spectroscopic technologies (see
Figure 8.2
) are
-
in addition to the
advantages described above
-
characterised by the following speci
c further
properties:
Passive IR instruments (
Figure 8.2a
) have the signi
cant advantage that meas-
urements at night are possible, since they rely on emission from the gas itself.
However, at present, instrumentation for recording IR spectra is still rather compli-
cated and comparatively expensive.
In comparison, DOAS instruments have been shown to be rather simple and
effective (e.g.
'
mini DOAS
'
, Bobrowski
et al
.,
2003
) making it, for instance,