Biology Reference
In-Depth Information
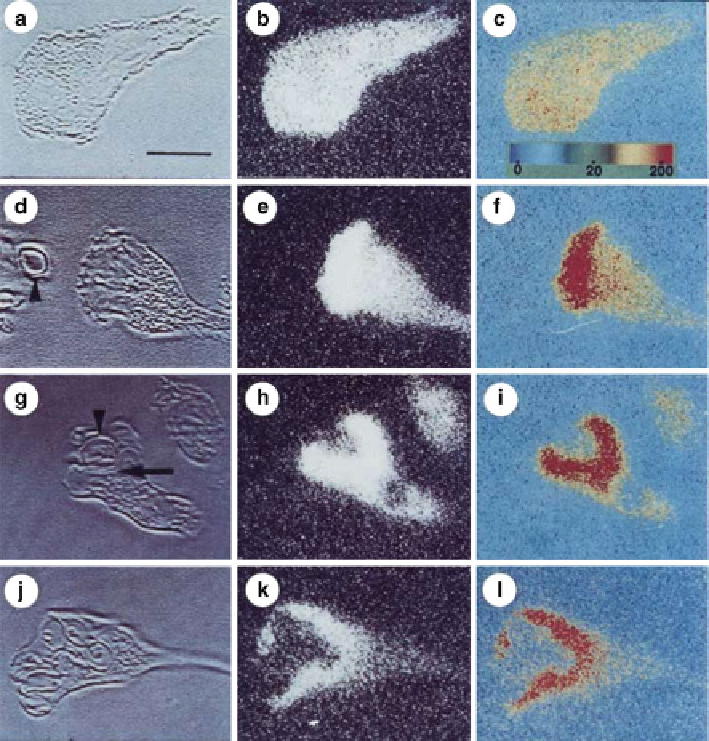
Fig. 3.2 Intracellular Ca
++
ion gradients generated in the cytosol of a migrating human neutrophil.
The intracellular Ca
++
ion concentration was visualized using the Ca
++
-sensitive fluorescent dye,
Quin2. The pictures in the first column are bright-field images of a human neutrophil, and those in the
second column are fluorescent images showing intracellular calcium ion distributions (
white
¼
high
calcium;
gray
low calcium). The pictures in the third column represent the color-coded ratio
images of the same cell as in the second column. Images on the first row
¼
¼
unstimulated neutrophil.
Images on the second row
the neutrophil migrating toward an opsonized particles, “opsonized”
meaning “being treated with certain proteins that enhance engulfing” by neutrophils. Images on the
third row
¼
¼
the neutrophil with pseudopods surrounding an opsonized particle. Images on the fourth
row
the neutrophil after having ingested several opsonized particles. Before migrating toward the
opsonized particle (indicated by the
arrows
in
Panels D
and
G
), the intracellular Ca
++
ion concentra-
tion in the cytosol was about 100 nM(see
Panel C
), which increased to several hundred nMtoward the
advancing edge of the cell (see
Panel F
) (Reproduced from Sawyer et al. (1985)
¼