Biology Reference
In-Depth Information
Table 19.1
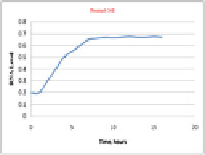
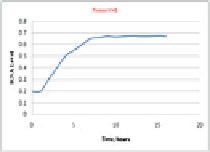
A diagrammatic representation of ribonoscopy and its application to “theragnostics.” The
time series plots
are hypothetical simulations, while the
structure series plots
are constructed utilizing the experimental data reported by Perou et al. (2000). For the definitions of the t- and s-ribons, see Table
18.1
RNA data type
Cell type
T1
t
11
+t
12
+t
13
+
T2
t
21
+t
22
+t
23
+
T3
t
31
+t
32
+t
33
+
¼
...
¼
...
¼
...
Time
series
(
t-ribons
)
A (type I)
(continued)