Biology Reference
In-Depth Information
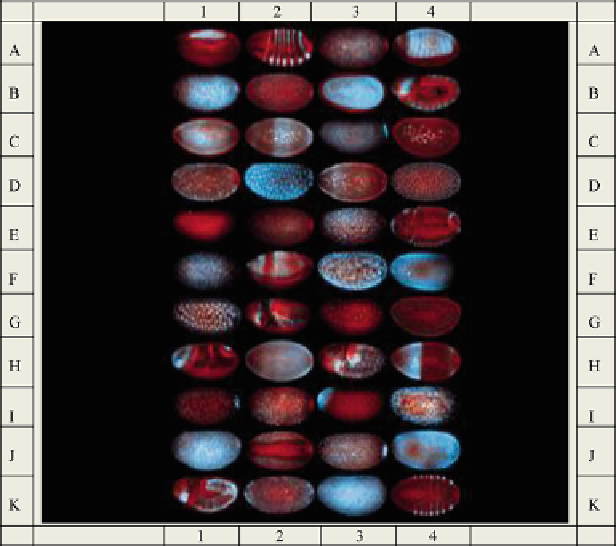
Fig. 15.1 Asymmetric distribution of mRNA molecules in
Drosophila
visualized with fluorescent
in situ hybridization (FISH) technique (L´cuyer et al. 2007). The mRNA molecules are depicted in
blue
and nuclei in
red
. There are a total of 44 embryo images in this figure in 11 rows and 4
columns. To identify individual images, rows are labeled with capital letters and the columns with
Arabic numerals. Thus, Image A1 will designate the image on the first row and the first column,
and Image K4 will designate the image on the last row and the last column, etc. (The embryo
images were reproduced from L´cuyer et al. 2007 by permission of
Cell
obtained through
Copyright Clearance Center)
to obey the
Triadic Control Principle
(TCP) described in Fig.
15.2
. Just as the
majority of workers in the field of DNA microarray technology in the past decade
committed false-positive and false-negative errors in interpreting their data due to
ignoring TCP (Ji et al. 2009a), so it can be predicted that researchers employing the
FISH technique to measure spatial distributions of mRNA signals such as shown in
Fig.
15.1
can make similar errors in interpreting their data if TCP is not taken into
account. For example, if an mRNA signal was found to be high in the anterior
region relative to the posterior region in a syncytial
Drosophila
blastoderm (e.g.,
see I3 in Fig.
15.1
), the usual interpretation is that the transcription rate of the
associated gene is higher in the anterior region than in the posterior region, or that
the associated gene is
expressed
in the anterior region but not in the posterior region
of the embryo (see Table 1 in L
´
cuyer et al. 2007). But, in the absence of
independent data, it would be impossible to rule out the alternative possibility