Biology Reference
In-Depth Information
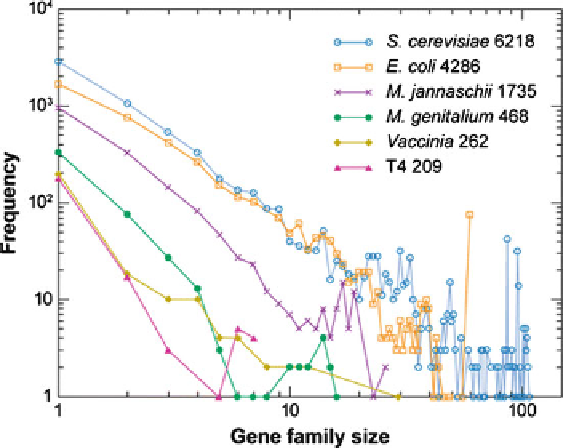
Fig. 14.6 The frequency distribution of gene family sizes (GFS) in the complete genomes of two
bacteria (
Escherichia coli
,
Mycoplasma genitalium
), an Archaea (
Methanococcus janaschii
), a
eukaryote (
Saccharomyces cerevisiae
), the vaccinia virus, and the bacteriophage T4. For example,
in the
S. cerevisiae
genome, there are about 500 families with 3 genes, 50 families with 10 genes
and 2 families with 50 genes. The gene family sizes were determined from the output of the Smith-
Waterman algorithm which compares two or more gene sequences (Huynen and van Nimwegen
1998). The power-law exponent,
g
, is called the Huynen-van Nimwegen exponent which is
thought to be proportional to the complexity of organisms and it is
2.81 for
S. cerevisiae
,
3.8 for vaccinia. The
number following the names of a species indicates the predicted number of protein-coding regions
in that species (Figure reproduced from Zeldovich and Shakhnovich 2008)
2.84 for
E. coli
,
3.27 for
M. janaschii
,
4.02 for
M. genitalium,
and
where P(S) is the probability or the frequency of the occurrence of gene family size
S within a genome (there being 3 to 700-800 gene families, depending on
genomes), c is the normalization constant, and
g
is the exponent of the power
law. Huynen and Nimwegen (1998) found that the numerical values of
g
ranged
from
4.0 across a dozen different genomes. Taking the logarithm of both
sides of Eq. 14.31 and plotting log P(S) against S predicts a straight line with slope
-
g
and
y
-intercept c, in approximate agreement with the plots shown in Fig.
14.6
.
2. Different genomes have different number of protein-coding regions (i.e., genes),
from 6,218 for
Saccharomyces cerevisiae
to 468 for
M
ycoplasma
genitalium,
and
this is reflected in the different sizes of the areas under the curves (AUCs): The
AUC of
S. cerevisiae
is much greater than the AUC of
M. Genitalium,
for example.
3. For a given genome size (i.e., species), the power-law relation between GFSs and
associated frequencies becomes poor (i.e., noisy) as GFSs increase beyond some
thresholds. For example, see the noisy plots in Fig.
14.6
for
S. cerevisiae,
Escherichia Coli,
and
Methanococcus jannaschii
as GFSs increase beyond
about 20 genes.
2.8 to