Biology Reference
In-Depth Information
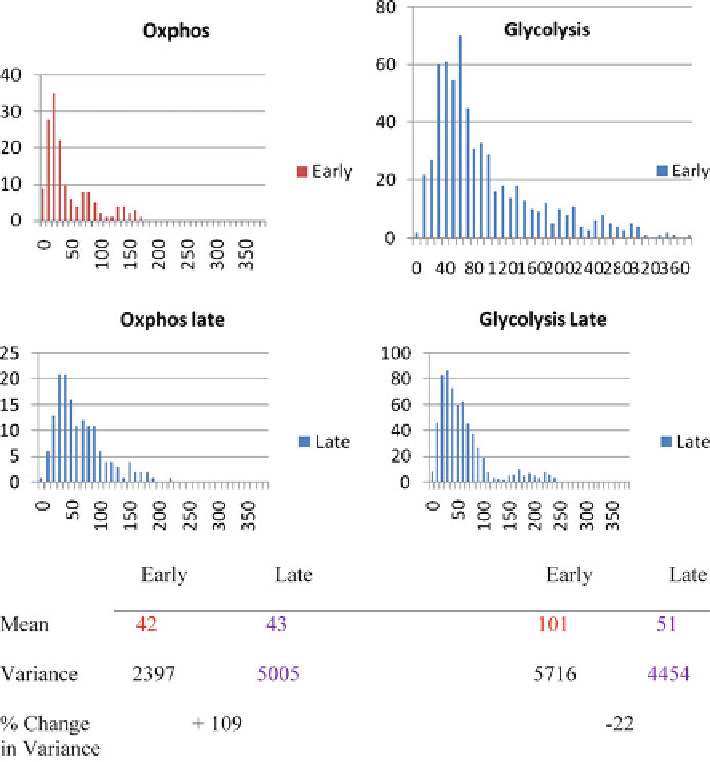
Fig. 12.24 Phenotypic distance vs. frequency (PDvF) plots of
oxphos
and
glycolytic
pathways in
the energy-poor early phase and the energy-rich late phase. The
x
-axis represents the phenotypic
distance divided into bins of 50 units and the
y
-axis records the number of points located
within each bin
of the pathway involved (Ji et al. 2009, unpublished observation). An increase in
the variance would indicate the opposite, namely, the deactivation of the metabolic
pathway. This interpretation is consistent with the fact that upon removal of
glucose, yeast cells (1) activate the oxphos pathway in order to generate ATP
from respiration converting ethanol (presumably left over from the glycolysis
before glucose was removed) to carbon dioxide and water and (2) subsequently
deactivate oxphos and activate glycolysis when the LeLoir enzymes are induced
(see Fig.
12.3
) which convert galactose to glucose-1-phosphate, the substrate for
the glycolytic pathway (Winderickx et al. 2002).