Biology Reference
In-Depth Information
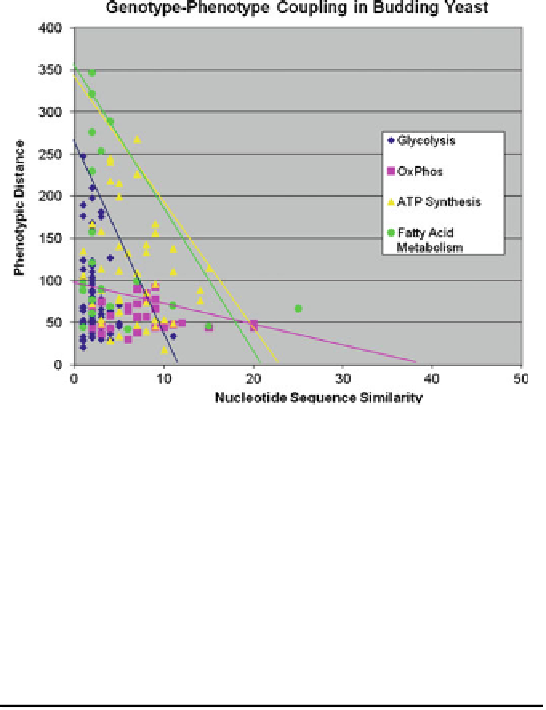
Fig. 12.18 The plot of the phenotypic distances between pairs of RNA against the genotypic
similarities between the corresponding RNA pairs. These RNA pairs belong to four metabolic
pathways as indicated in the box (The RNA level data from Garcia-Martinez et al. 2004)
Table 12.7 The varying degrees of the efficiency of self-regulation by
structural genes. n
¼
the number of RNA molecules or ORFs
Functions of RNA (n)
Slope
y
-intercept
1. Glycolysis (16)
24.1
11
2. Oxidative phosphorylation (18)
2.6
38
3. ATP synthesis (18)
18.1
21
4.
Fatty acid synthesis (14)
23.5
17
of the slope of a GSvPD plot may be employed as a quantitative measure of the
self-regulatory power of structural genes
(SRPSG):
j
1
SRPSG
¼j
Slope of GSvPD plot
(12.22)
On the basis of Eq.
12.22
and the data given in Fig.
12.17
and Table
12.18
, it may
be concluded that the structural genes of the glycolytic pathway have a lesser
self-regulatory power
than those of the oxidative phosphorylation pathway. Alter-
natively, it may be stated that glycolytic genes are more “other-regulated” than
oxphos genes, “other-regulated” meaning the opposite of “self-regulated,” i.e.,
regulation by DNA regions other than structural genes such as promoters,
enhancers, and silencers.
It is important to keep in mind that the points in the GSvPD plot such as
Figs.
12.17
and
12.18
represent differences between two sets of numbers,
D
G
AB
and
D
P
AB
, where
D
G
AB
is the genotypic difference between RNA molecules A and