Biology Reference
In-Depth Information
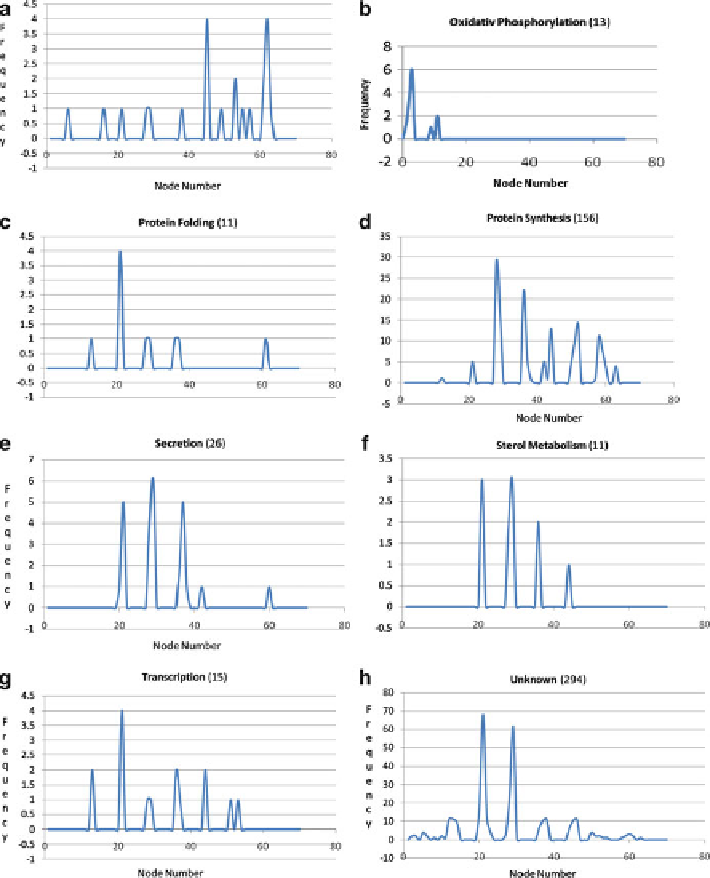
Fig. 12.12
The RNA spectra (or ribonic spectra
). The patterns of the distributions of
ribons
such
as shown in Fig.
12.1
are represented as what is here referred to as the “RNA spectra”(or “ribonic
spectra”) which can be obtained by linearizing the two-dimensional (street-avenue)
addresses
of
the RNAs on the three-dimensional plots (e.g., Fig.
12.11
)as
node numbers
on the
x
-axis and
plotting the frequency on the
y
-axis
Focusing on the uppermost row of the three-dimensional plot in Fig.
12.10
, what
ViDaExpert has done is to project the original data points in the six-dimensional
RNA concentration space to the two-dimensional principal grid, i.e., the plane with
x and y coordinates. The columns with different heights standing on the xy-plane