Biology Reference
In-Depth Information
10.6 A Historical Analogy Between Atomic Physics
and Cell Biology
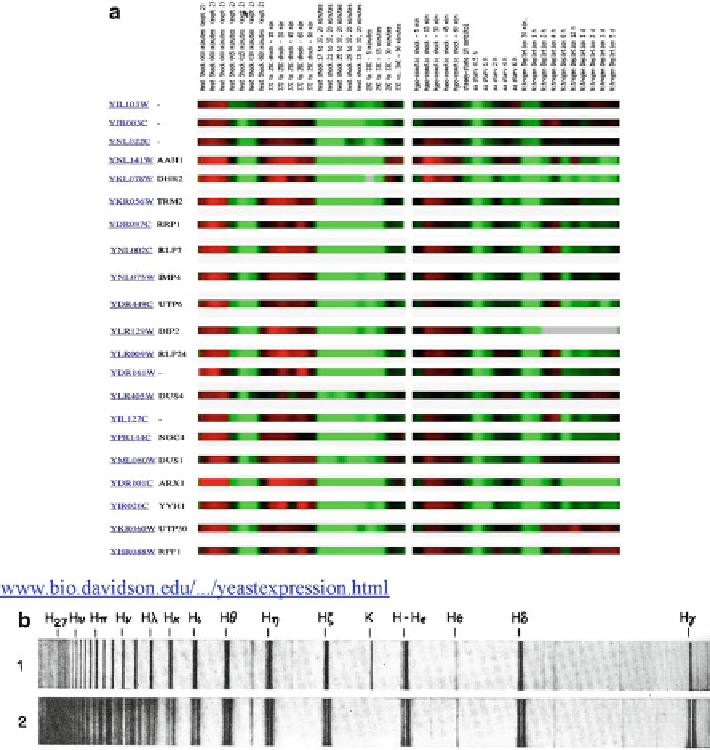
When I first saw a picture similar to the one shown in Fig.
10.5a
in an international
conference on DNA microarray data analysis held at Rutgers around 2003, I was
struck by the superficial similarity between this picture and the atomic absorption
spectra such as shown in Fig.
10.5b
. The former displays the concentration of RNA
molecules in cells encoded by various genes displayed on the left-hand side of the
Fig. 10.5 (a)
The microarray expression profiles
: The changes in the RNA levels of a group of yeast
genes induced by environmental manipulations;
red
¼
increase;
black
¼
no change;
green
¼
decrease;
gray
data missing or not measured. (b) The atomic spectra of the hydrogen atom:
(
1
) The hydrogen atomabsorption lines detected in the light from
Zeta Tauri.
(
2
) The same absorption
lines observed in the light from another star, 11
Camelopaadlis
(Moore 1963, p. 472)
¼