Database Reference
In-Depth Information
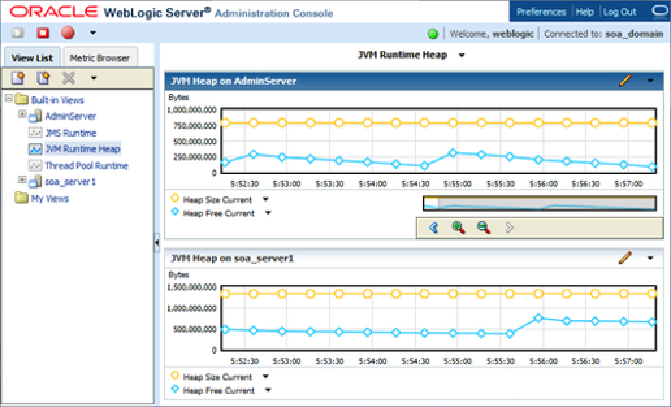
From the Oracle WebLogic Server Monitoring Dashboard, the Thread Pool
Runtime can also be monitored in real-time. The key is to monitor the Hogging
Thread Count and the Pending User Request Count. On a low usage envir-
onment, these should ideally be hovering around zero. From the Oracle We-
bLogic Administration Console, navigate to
Servers
|
[soa_server]
|
Monitor-
ing
|
Threads
to view these important statistics along with the thread pool and
the thread pool threads. Everything from
Active Execute Threads
to
Hogging
Thread Count
is shown on this page. The Throughput shown on this page is a
single value that denotes the mean number of requests completed per second.
The higher this value, the better. But the thread pool changes its size automatic-
ally to maximize throughput, so in normal cases there is nothing you need to do
aside from monitoring it to understand the behavior of your server under different
types of load. This chapter provides WLST code that can be executed anytime
to obtain JVM specific statistics.