Environmental Engineering Reference
In-Depth Information
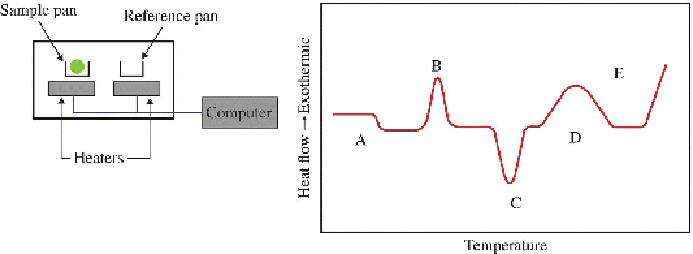
heat flow to each pan at a given temperature to be monitored separately.
The plastic sample to be analyzed is placed in one of the pans; the difference
in heat flow needed to maintain both pans at the same temperature is
accurately recorded during the heating process. It is essentially a
measurement of the heat capacity of the sample as a function of
temperature. The value of Δ
T
(°C) plotted as a function of temperature
T
(°C) yields a DSC trace that reflects the thermal characteristics of the
material. A generalized DSC trace of a semicrystalline polymer is shown
in
Figure 3.11
showing the features associated with changes on heating the
plastic sample.
Figure 3.11
Left
: Basic features of a DSC instrument.
Right
: A generalized
DSC tracing.
The DSC curve shows the crystallization exotherm (B) and a melting
endotherm (C) followed by an exothermic decomposition of the plastic (E)
at higher temperatures (Bruns and Ezekoye, 2014). At a lower temperature,
a first-order step change in the curve (A) is apparent and signifies the Tg
of the material (Feng et al., 2013), and in some instances, a transition that
signifies cross-linking (D) is also observed.
The melting transitions for blends of PP are shown in
Figure 3.12
. The area
under the DSC tracing of differential heat flow (
dH
/
dT
) is the enthalpy
change associated with the transitions. This is the sum of heat capacity
and the heat flow needed to accommodate the physical/chemical changes
undergone by the plastic material: