Agriculture Reference
In-Depth Information
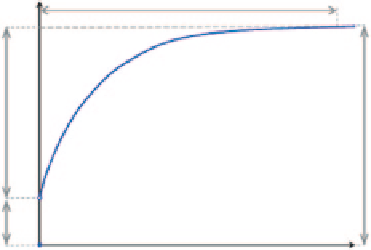
Fig. 6.4
The spatiovariogram
and its characteristics from
the SAS/STAT(R) 9.3 Users
Guide. The nugget, sill, and
range are commonly used to
describe the spatial variability
of an ecological characteristic
Semivariance
(h)
Range
α
γ
Partial Sill
σ
o
2
σ
Sill
c
o
Nugget Effect
c
n
Distance
h
0
Spatial variability is an important landscape characteristic for describing land-
scape structure in continuous wildland fuel variables. It is often described using
semivariograms; a descriptive technique that graphically represents the spatial con-
tinuity and autocorrelation of a spatial data set (Bellehumeur and Legendre
1998
;
Townsend and Fuhlendorf
2010
). Semivariogram
range,
the distance where the
variance curve first flattens (Fig.
6.4
), is important in landscape ecology because it
represents the spatial scale at which the entity of concern is best described in space,
often called the inherent patch size (Fortin
1999
). Using semivariograms, Keane
et al. (
2012a
) estimated the spatial scale of individual fuel components on several
US Rocky Mountain landscapes. They found that the smaller the fuel component,
the finer the scale of spatial distribution. FWD varied at scales of 1-5 m, depend-
ing on the fuel particle, but CWD varied at 50-150 m and canopy fuel characteris-
tics varied at 100-400m scales. This limited study shows that each fuel component
has its own inherent scale and that this scale varies by biophysical environment,
vegetation structure and composition, and time since disturbance. The implications
of these findings are found in nearly all chapters of this topic. Fuel classification
effectiveness can be compromised because the variability of loadings across the
unique spatial scales overwhelms the ability of the classification to uniquely iden-
tify disparate fuel classes (Chap. 7). Fuel sampling must account for the diverse
scales of distribution between fuel components in sampling designs (Chap. 8), and
fuel mapping must match the scale of mapping approaches and imagery to the scale
of the fuel components being mapped to create accurate and consistent fuels layers
(Chap. 9) (Fig.
6.4
).
Another finding of the Keane et al. (
2012b
) study was the high spatial vari-
ability of a number of fuel properties within a site. The variability in loading for
any fuel component was often twice the mean, even within a small homogeneous
sampling area, and most other fuel properties, such as particle density, bulk density,
and mineral content, also exhibited high variabilities (Table 3.2). They also found
that this variability was not normally distributed but instead highly skewed towards
the lower fuel values. Other findings were that this high variability could not be
explained by any vegetation-based measurement or fuel loading estimate from any
Search WWH ::

Custom Search