Chemistry Reference
In-Depth Information
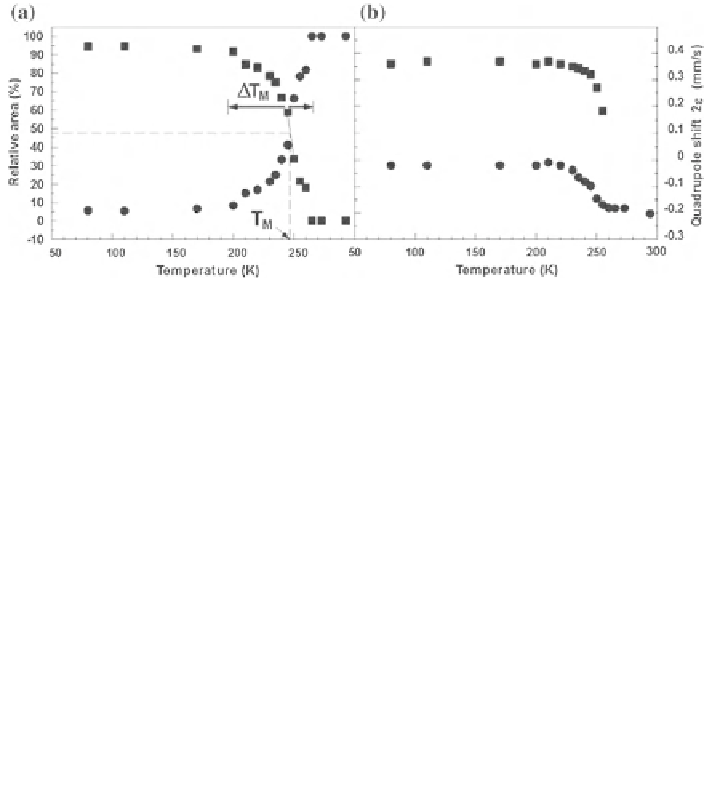
Fig. 3.11 Temperature behavior of the transition region: relative area (a) and the quadrupole
shift 2e (b) for a small-particle hematite
Fig. 3.12 Morin transition
temperature vs. inverse
average particle size for
differently prepared hematite
samples (Black square
prepared from decomposition
of lepidocrocite; for the other
symbols, see Ref. [
99
])
that picture it follows that this transition temperature is not solely dependent on the
particle size, but also differs according to the preparation method. Large defects and
the presence of hydroxyl groups (OH
-
) probably cause the large fluctuations in T
M
[
92
-
94
]. However, hematite samples prepared from lepidocrocite generally show the
highest transition temperatures [
95
-
97
] and it is believed that natural samples, which
are mostly formed from ferrihydrite will possess the same features. The shaded band
shown in Fig.
3.12
might be a reasonable analytical guideline for the relation
between T
M
and the average particle dimensions.
Isomorphous Al for Fe substitution in hematite is also a common phenomenon
and has been intensively studied [
92
,
96
,
98
-
101
]. Hematite can contain more than
15 at % Al and, similarly to goethite, this diamagnetic substitution has primarily a


