Chemistry Reference
In-Depth Information
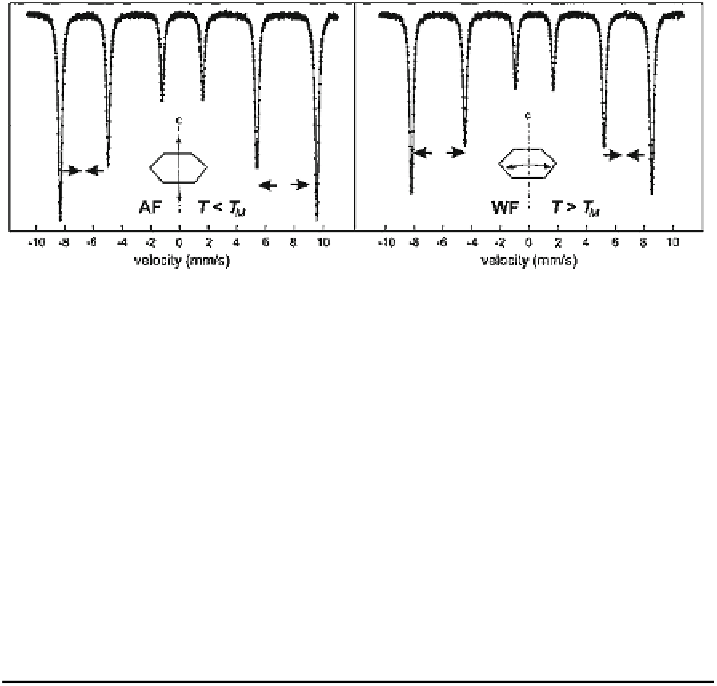
Fig. 3.9 Mössbauer spectra of hematite in the antiferromagnetic state at 80 K (left) and in the
weakly ferromagnetic state at RT (right)
Table 3.4 Representative hyperfine parameters of hematite of various crystallinity
Crystallinity
T (K)
Spectrum
B
av
(T)
B
p
(T)
2e (mm/s)
d
Fe
(mm/s)
High
RT
S(WF)
51.7
=B
av
-0.19
0.36
80
S(AF)
54.1
=B
av
0.38
0.47
4
S(AF)
54.2
=B
av
0.39
0.48
Medium
RT
S(WF)
50.0-51.0 &B
av
-0.20
0.37
80
S(WF)
52.5-53.0 &B
av
-0.19
0.47
S(AF)
53.5-54.0 &B
av
[0.10
0.47
4
S(AF)
54.2
=B
av
0.38
0.48
S(WF)
53.3
=B
av
-0.20
0.48
Poor
RT
S(WF)
37.0-48.5
49.5-50.0
-0.21
0.37
80
S(WF)
52.0-53.0 &B
av
-0.20
0.47
4
S(WF)
53.2
=B
av
-0.20
0.48
behavior is well reflected in the Mössbauer spectra. The hyperfine parameters of
hematite at different temperatures are given in Table
3.4
.
The hyperfine field B in the AF state at 4 and 80 K are nearly equal which is
conceivable in view of the high T
N
. In the WF state at RT a value of 51.7 T is
observed. At the Morin transition temperature T
M
, B changes abruptly. The drop of
about 0.8 T is explained by the influence of the spin reorientation on the orbital and
dipolar contributions to B [
81
]. The quadrupole shift 2e, which is only slightly
temperature dependent, changes more drastically at T
M
. At 80 K a large positive
value of 0.38 mm/s is observed whereas the WF state has a negative value of
-0.19 mm/s at RT (indicated by arrows in Fig.
3.9
). The relation between those two
values is consistent with the EFG principal axis lying in the direction of the c-axis. In
view of this large difference in 2e both the WF and AF phase can be separately
identified from the fitting, and therefore MS is an extremely powerful tool to study the
Morin transition. Moreover, because the latter is very sensitive to microcrystalline
effects, lattice imperfections and impurities, it is clear that this technique could offer
some possibilities for the characterization of hematite in natural samples.