Java Reference
In-Depth Information
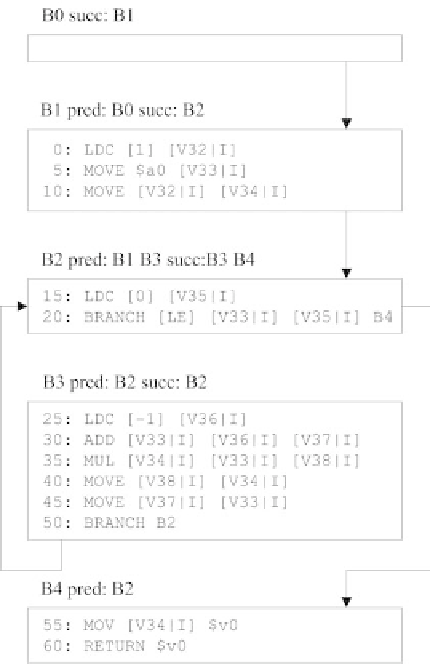
For example, consider the control-flow graph for
Factorial
's
computeIter()
in Figure
7.1. Here, it is composed of the LIR instructions that we computed in Chapter 6.
FIGURE 7.1 Control-flow =graph for
Factorial.computeIter()
.
The liveness intervals for this code are illustrated in Figure 7.2. We shall go through the
steps in constructing these intervals in the next sections. The numbers on the horizontal axis
represent instruction ids; recall, instruction ids are assigned at increments of 5 to facilitate
the insertion of spill code. The vertical axis is labeled with register ids.
FIGURE 7.2 Liveness intervals for
Factorial.computeIter()
.


Search WWH ::

Custom Search