Environmental Engineering Reference
In-Depth Information
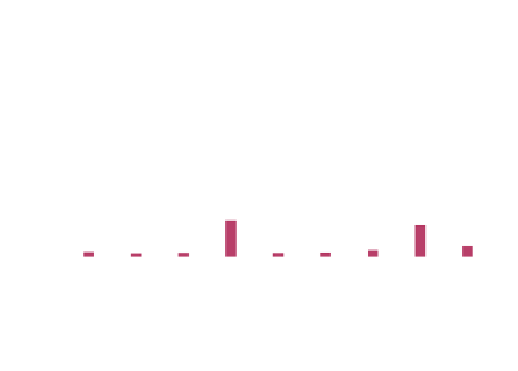
0.058-1.71 mg L
-1
for the top, middle and bottom strata,
respectively (Figs.
2
,
3
).
In most cases, the levels observed were higher than the
0.04 PO
3
—P limit and above this concentration algal bloom
starts to occur (Wallace et al.
2010
).
1.0
0.9
Top
Middle
Bottom
0.8
0.7
0.6
0.5
0.4
Potentially Toxic Elements in Sediments
of the Lagos Lagoon System
0.3
0.2
0.1
In a 2006 study, our group collected surface sediments from
the Lagos Lagoon, Nigeria, and three adjoining rivers/
estuaries (Odo-Iyaalaro River, Shasha River and Ibeshe
River) and these were analysed for their physicochemical
properties, pseudo-total concentration, fractionation pattern
as well as the ecotoxicological implication of the potentially
toxic metals (PTM): Cd, Cr, Cu, Pb and Zn.
According to Oyeyiola et al. (
2013a
), the Odo-Iyaalaro
River was observed to be the most polluted river, with
highest concentrations of 42.1, 102, 185, 154 and
1040 mg kg
-1
of Cd, Cr, Cu, Pb and Zn, respectively. The
month of March, which is the peak of the dry season, had
particularly higher concentration of metals compared with
samples collected from the same point in other months. This
was attributed to the accumulation of these PTMs in sedi-
ment during the dry season, which are then remobilised
during the rainy season. In their study, it was reported that
previous workers observed seasonal influence on sediment
metal concentrations in tropical systems, but findings are
contradictory. Similar to their study, Bahena-Manjarrez
et al. (
2002
) observed the highest metal concentrations in
the dry season in the Coatzacoalcos River, Mexico, and this
was supported by Alagarsamy (
2006
) who reported the
lowest metal concentrations during the monsoon in the
Mandovi estuary, India.
Oyeyiola et al. (
2013b
) also found potentially toxic
elements (PTE) concentrations in sediments from the Sha-
sha River to decrease with decreasing distance from the
Lagos Lagoon. This variation was said to correlate with the
location of industries and their waste-disposal systems. The
average concentrations of PTE in the Shasha River were
lower than in the Odo-Iyaalaro River. The Ibeshe River was
the least contaminated, apart from a site affected by Cu
from the textile industry. The concentration of Cu was also
found to decrease downstream with increasing distance into
the Lagos Lagoon.
They also observed in their studies that the western part
of the Lagoon had higher concentrations of the studied
metals than the other parts. This was in agreement with
researchers (Otitoloju et al.
2007
) who also observed higher
concentration of metals in the western part of the lagoon.
These may be because there are a lot of bridges around
these area as compared with the other parts of the lagoon
0.0
L1
L2
L3
L4
L5
L6
L7
L8
L9
Location
Fig. 2
Average concentration of bioavailable phosphate in the water
of the Lagos Lagoon
4.0
3.5
Top
Middle
Bottom
3.0
2.5
2.0
1.5
1.0
0.5
0.0
L1
L2
L3
L4
L5
L6
L7
L8
L9
Location
Fig. 3
Average concentration of total phosphate in the water of the
Lagos Lagoon
and also there is a lot of human activities. In our study, it
was observed that Cr concentration in the Lagos Lagoon
was generally high even though the range is small. This is
probably an indication that Cr in the Lagos Lagoon is ge-
ogenic. There was no difference were observed between
concentrations of metals in rainy and dry seasons in the
lagoon, nor were there marked seasonal differences in grain
size distribution, as had been observed in some of the
tributary rivers. This was to be expected because according
to Lund-Hansen et al. (
1999
), re-suspension rate was
observed to be much more higher than sedimentation rate in
shallow coastal lagoons and the depth of Lagos Lagoon
waterbody means that deposition, as well as re-suspension,
is likely to occur throughout the year.
Due to lack of legislation in Nigeria governing accept-
able levels of PTE in sediments, it was not possible to assess
or contextualise the current findings within a local regula-
tory framework, so the consensus-based probable effect
concentrations (PEC) recommended by MacDonald et al.
(
2000
)
and
Dutch
sediment
guideline
(Grimwood
and


Search WWH ::

Custom Search