Environmental Engineering Reference
In-Depth Information
the LULC maps were used, so those pixels with equal
thematic label were considered stable over time.
Under the two assumptions, the NDVI difference is
centered on zero, and there is a value m
d
, the mean value of
the NDVI decreasing component, and a value m
i
, the mean
value of the NDVI increasing component. The no-change
area is defined using the interval ½m
d
þ
cs
d
;
m
i
þ
cs
i
.
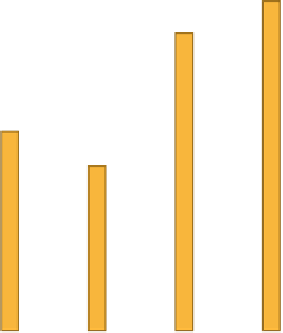
1200
1000
800
600
Results and Discussions
400
Land-Cover Change
200
Classification
Using the classification method described above, the area of
land-cover types in each of four study images was obtained
and regional characterization of land-cover and land-cover
changes was understood for Saloum estuary over the twenty-
five-year period from 1984 to 2010. The results reveal that
substantial changes took place during this time. The confu-
sion matrices and kappa values were calculated from test
samples for the four single-date classification results (Fig.
3
):
October 1984, October 1992, November 1999, and Novem-
ber 2010. The accuracy derived from the November 2010
image is evidently lower than that from 1984, 1992, and 1999
images (kappa value 0.79 vs. 0.90 or 0.87 or 0.85, or overall
accuracy of 78 vs. 90 or 87 or 84 %). The lower classification
accuracy might be due to the poorer quality of 2010 raw
image strips in comparison with the other. Table 4 presents
three change matrices that reflect the change directions and
percentages of land-cover types based on the single-date
classification results. The change matrices were calculated by
overlaying the four single-date classification maps. The
water area has increased in 1992 and 1999, and mangrove
(high and low) and ''tan'' were lost by immersion because the
break of the Sangomar spit in 1987. From 1984 to 1992, 55 %
of high mangrove shifted to low mangrove and 6 % of low
mangrove degraded to denudate soil (''tan''). These changes
and conversions increased from 1992 to 1999, and 72 % of
high mangrove transformed to low mangrove and 7 % of low
mangrove and 3 % of savanna shifted to ''tan'' (Table
1
). In
1999, due to high precipitation (Fig.
4
) and sea level rise, the
water surface also increased by 15 %.
0
1984
1992
1999
2010
Year
Kaolack (river station)
Toubacouta (coastal station)
Fig. 6
Average mean annual precipitation (MAP) for 5 years prior to
each date showing decreasing trend over time
dates, as suggested by Pu et al. (
2008
). In the present study,
the NDVI differences between 1984 and 1992, 1992 and
1999, and 1999 and 2010 were computed.
After the computation of NDVI differences, the threshold
values that will define the change/no-change areas must to
be computed. In this step, it is assumed that the difference in
NDVI presents a normal distribution centered on zero
(Lunetta and Elvidge
1998
; Pu et al.
2008
). In practice, this
is usually not the case in that the NDVI differences have
mean value very close but different to zero. Additionally, it
is also assumed that NDVI increasing and decreasing parts
present a normal distribution (Pu et al.
2008
). Under these
two assumptions, Pu et al. (
2008
) determined the threshold
values that can be used to identify the change/no-change
areas by computing the no-change interval:
½m
d
þ
cs
d
;
m
i
þ
cs
i
, where m
d
is the mean value and s
d
is
the standard deviation of the decreasing component; simi-
larly for m
i
;
s
i
(Fig.
2
). The constant c can be determined
using methods based on the kappa value or accuracy
assessment (Pu et al.
2008
). However, in this study, the
NDVI differences presented a very small standard deviation
value. This fact implies that the extreme values in the no-
change interval tend to be very near to the global mean
value. Thus, the threshold values were set as equal to the
NDVI difference mean value. This raises the problem of
how to detect no-change areas. To overcome this difficulty,
NDVI Differencing
Over the NDVI images (Fig.
5
), areas with gray reflect
higher NDVI. From Fig.
4
, the area reflecting higher NDVI
(areas with gray) on the 2010 image is larger than that on
the other three images. For NDVI index normalization
between an NDVI image pair, the three linear regression
equations are as follows:


Search WWH ::

Custom Search