Environmental Engineering Reference
In-Depth Information
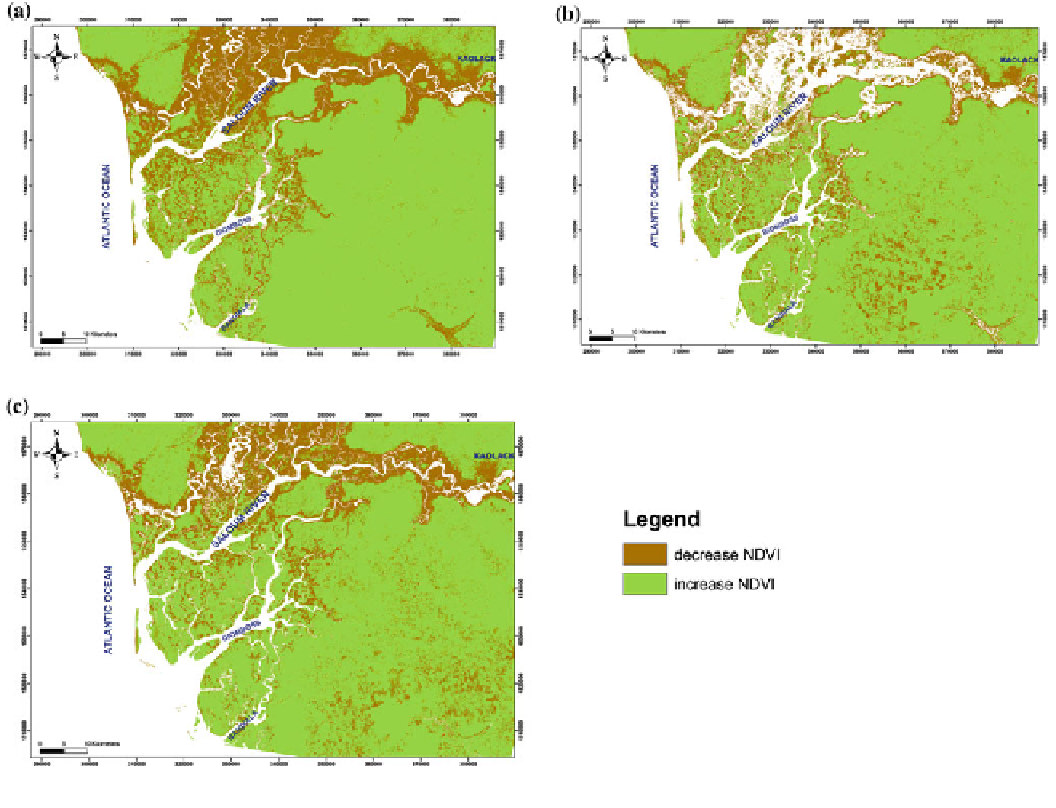
Fig. 5
Maps show areas of NDVI increase and areas of NDVI decrease between 1992 and 1984 (a), 1999 and 1992 (b), and 2010 and 1999 (c)
positive values are related to biomass variables, indicating
leaf cover or productivity (Wang et al.
2003
; Filella et al.
2004
; Pettorelli et al.
2005
; Zinnert et al.
2011
).
Due to differences in atmospheric and land surface
conditions and phenological stages, among other factors,
during the acquisition, the satellite images exhibit differ-
ences in spectral behavior (Pu et al.
2008
). The purpose of
change detection is to extract the true LULC changes. Prior
to that, it is important to normalize the images in order to
identify the changes caused by other factors. It is worth
noticing that the radiometric normalization does not com-
pletely correct the spectral behavior (Pu et al.
2008
), i.e., the
procedure will normalize the spectral values to a similar
level for the two images acquired in different dates.
In this study, the normalization procedure was based on
the work of Pu et al. (
2008
). The normalization was not
done over the NIR and RED bands, but rather over the
NDVI. This procedure required less time, due to the
reduced number of samples necessary to collect when
compared with normalizing the NIR and RED separately. In
the normalization procedure, the NDVI values from one
date are assumed to be in a linear relation with the NDVI
values from the other date. That is, it is possible to correlate
using y ¼ ax
þ
b, where x is the pixel value of one image,
y is its correspondent value, and a and b are coefficients
determined by least-square linear regression (LSLR). The
x image is usually called the reference image, and the
y image is called the subject image (Lunetta and Elvidge
1998
). To compute the LSLR parameters, it is necessary to
collect a sample of pixel values. In this work, we have
applied the pseudo-invariant feature (PIF) method described
by Schott et al. (1988), to collect the samples. PIF are pixels
that do not represent changes in their spectral response over
the period of time in analysis. The PIF method is based on
two poles, namely very dark pixels and very bright pixels.
Typically, the dark PIFs can be found in deepwater pixels
and the bright sets on surfaces with very little or no vege-
tation, like barren soil and rock (Lunetta and Elvidge
1998
).
These two poles are the basis to sample pixel values for
normalization. Once the coefficients are determined, it
becomes possible to apply the linear function to compute
the predicted NDVI and then the difference between two
Search WWH ::

Custom Search