Environmental Engineering Reference
In-Depth Information
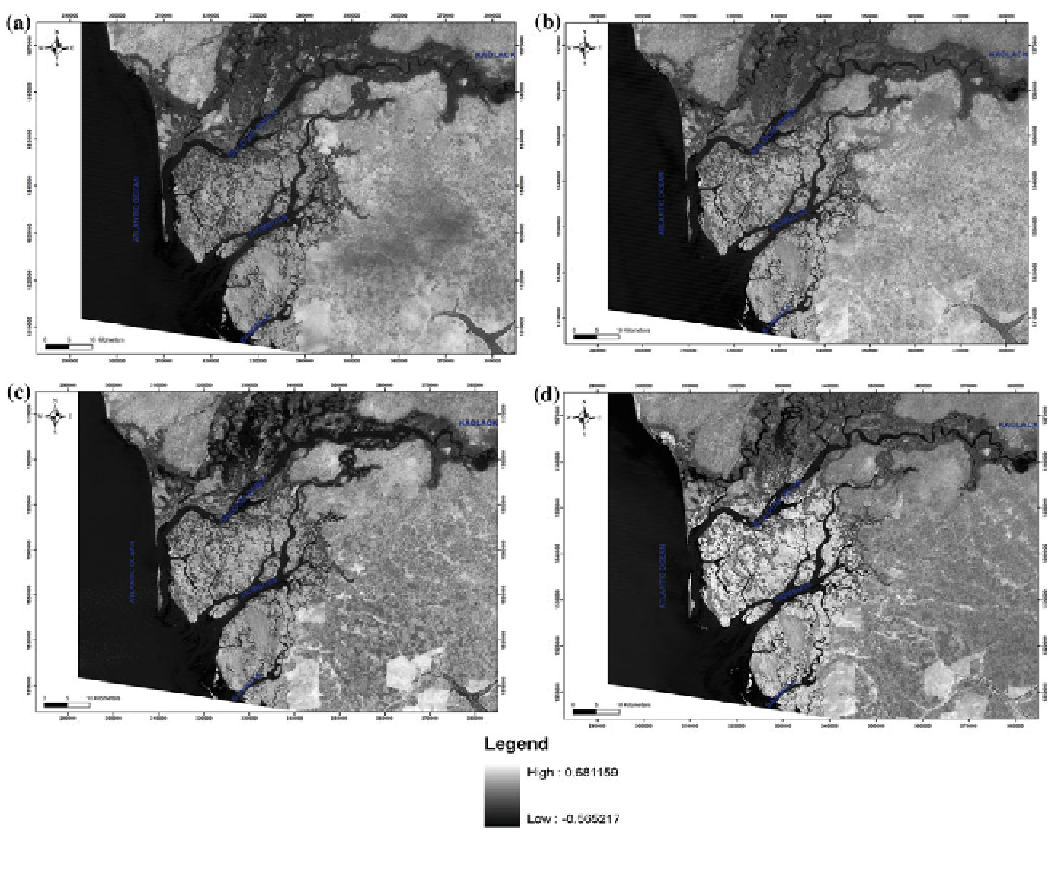
Fig. 4
NDVI images of the four Landsat images: a October 1984, b October 1992, c November 1999, and d November 2010. The NDVI images
were calculated with the NIR band, the red band
The overall accuracy and a kappa analysis were used to
perform a classification accuracy assessment based on error
matrix analysis. Using the simple descriptive statistics
technique, overall accuracy is calculated by dividing the
total correct by the total number of pixels in the error
matrix. The kappa analysis is a discrete multivariate tech-
nique used in accuracy assessments (Jensen
1996
), and it
yields a KHAT statistic (an estimate of kappa) which is a
measure of agreement or accuracy (Congalton and Green
1993
). It is a measure of overall statistical agreement of an
error matrix, which takes non-diagonal elements into
account, and it is recognized as a powerful method for
analyzing a single error matrix and for comparing the dif-
ferences between various error matrices (Congalton
1991
;
Smits et al.
1999
; Foody
2004
).
The next step was to generate a cross-tabulation using
GIS technique that combines the information of two types
of raster files into a contingency matrix. The procedure
consists of counting pairs of categorical values of two given
variables
in
order
to
produce
a
categorical
frequency
distribution.
NDVI Differencing Method
The NDVI differencing method employs NDVI to differ-
entiate images for mapping pixel change in the land-cover
types. It is a popular vegetation index differencing used for
change detection. For the NDVI differencing method, the
NDVI image for each year was first computed according to
Tucker (
1978
) using the NIR and RED bands (Eq.
6
):
NDVI ¼
NIR
RED
NIR
þ
RED
ð
6
Þ
NDVI is derived from differences in reflectance of the
red (pigment absorption) and near-infrared (scattering from
cellular structure), with values ranging from -1 to +1.
Negative values refer to an absence of vegetation, while
Search WWH ::

Custom Search