Environmental Engineering Reference
In-Depth Information
Table 4
Soil organic carbon
(SOC) along the different forest
conditions in Central Africa
mangroves
Forest condition
Soil Depth (cm)
Total (Mg C/
ha)
0-15
15-30
30-50
50-100
Undisturbed
157.8 ±
22.8
182.4 ±
70.7
230.5 ±
39.9
396.7 ±
108.6
967.4±57.6
Moderately
exploited
169.1± 34.5
140.0± 45.6
167.2± 86.3
303.9± 198.0
780.2± 162.9
Heavily exploited
130.1 ±
18.1
147.0 ±
33.6
156.6 ±
58.4
306.8 ±195.5
740.6 ±189.6
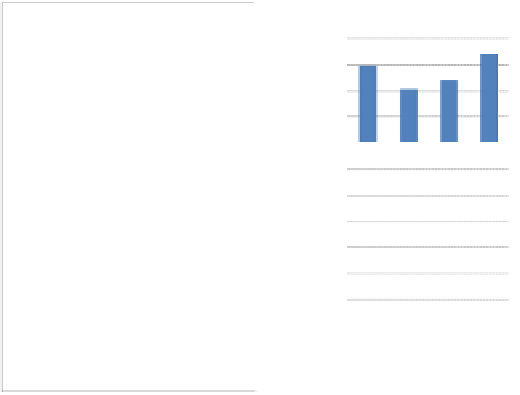
Fig. 5
Partitioning of carbon
stocks in mangroves of Central
Africa under different conditions
Moderately exploited forests
Undisturbed mangrove forests
Heavily exploited forests
800
800
800
600
600
600
400
400
400
200
200
200
0
0
0
-200
-200
-200
-400
-400
-400
-600
-600
-600
-800
-800
-800
-1000
-1000
-1000
-1200
-1200
-1200
Table 5
Total ecosystem carbon
stocks in mangroves of Central
Africa under different
perturbation regimes
Pools
Heavily Exploited
Moderately
Exploited
Undisturbed
Trees Mg/ha
SE
Mg/ha
SE
Mg/ha
SE
Aboveground
Live component
58.0
50.4
123.3
179.7
467.1
70.0
Dead component
6.1
3.7
16.4
18.1
70.6
85.2
Total Aboveground
64.1
49.9
139.6
181.4
537.7
116.5
As % total
7.2
4.0
14.1
16.6
35.1
4.2
Belowground
Tree-roots 3.1 1.4 12.1 18.8 15.1 4.2
Total Soil 740.6 189.6 773.6 162.9 967.4 57.6
Total Belowground 743.6 190.9 785.7 149.8 982.5 60.8
As % total 92.8 4.0 85.9 16.6 64.9 4.2
Total ecosystem carbon stock (Mg/ha) 807.8 235.5 925.4 137.2 1520.2 163.9
Carbon pools of trees (aboveground) were calculated as the product of tree stand biomass multiplied 0.5
CO
2
value is derived by multiplying C stocks by 3.67, the molecular weight ratio of CO
2
to C
Ocean could explain high organic carbon content in the
soils of even mangroves that are in degraded conditions.
There was high variation in SOC in the 50-100-cm depth as
compared to the rest of the zones (Table
4
, Fig.
5
).
982 Mg/ha (or 65 %) in belowground component (soils and
roots) and 538 Mg/ha (35.0 %) in the aboveground biomass
(Fig.
5
). Total ecosystem carbon stocks differed signifi-
cantly (p \ 0.05) with forest conditions. The lowest eco-
system carbon of 808 ± 236 Mg/ha was recorded in
moderately degraded forests, translating to CO
2
equivalent
of 2,962 Mg/ha (mean: 808 ± 236 Mg/ha) (Table
5
).
These figures are comparable to other studies around the
world,
Total Ecosystem Carbon
Based on the four major carbon pools accounted in this
study, total ecosystem carbon in undisturbed mangrove of
Central Africa was estimated at 1,520 ± 164 Mg/ha with
which
have
shown
average
values
of


Search WWH ::

Custom Search