Biomedical Engineering Reference
In-Depth Information
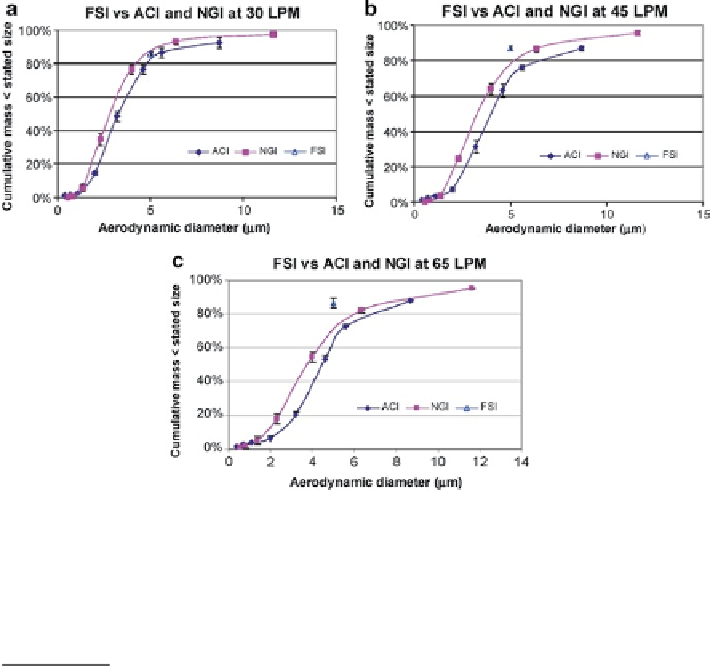
Fig. 10.58
Comparisons of
FPF
<5.0μm
reported by Sheng and Watanabe from a pMDI-produced
aerosol measured by FSI, NGI, and ACI at different flow rates; error bars represent ±1 SD. (
a
)
30 L/min. (
b
) 45 L/min. (
c
) 65 L/min (
From
[
53
]—
courtesy of G. Sheng
)
Table 10.16
Nebulizer formulations tested in the study of Sheng and Watanabe; “+” high,
“0” medium, “−” low value relative to series average (
From
[
53
]—
courtesy of G. Sheng
)
Particle morphology
based on aspect
ratio (−, +)
Size of
particles in
formulation
Formulation
code
Surfactant type (0, I, II)/
concentration (+, −)
API concentration
(−, 0, +)
A
−
I/+
+
Submicron
B
−
I/+
+
Submicron
C
−
I/− and II/−
−
Submicron
D
−
I/0 and II/−
0
Submicron
E
−
I/+
+
Submicron
F
+
I/+
+
Micron
G
−
I/+
+
Micron
H
−
I/+
+
Micron
I
+
I/+
+
Micron
surfactant (Table
10.16
). Their results (Fig.
10.59
), obtained at higher flow rates
than recommended (15 L/min) for evaluating this class of inhaler (28-30 L/min),
nevertheless demonstrated an excellent correlation (
r
2
~ 0.97) between these abbre-
viated and full-resolution apparatuses.
Sheng and Watanabe also extended their comparison of the FSI to the evaluation
of a vibrating membrane nebulizer (Aeroneb
®
Go, Aerogen Ltd., Galway, Ireland)


Search WWH ::

Custom Search