Biomedical Engineering Reference
In-Depth Information
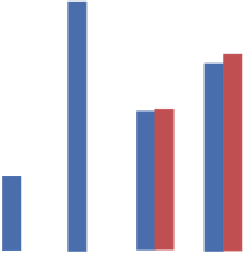
Replication of two patient representative inhalation profiles by Electronic Lung.
APSD characterised by NGI or FSl
70.0
Patient profile 1
Patient profile 2
60.0
50.0
40.0
NGI
FSI
30.0
20.0
10.0
0.0
SPM
LPM
SPM
LPM
SPM
LPM
SPM
Component 2
LPM
Component 1
Component 2
Component 1
Fig. 10.49
Comparison of NGI and FSI data post replication of human patient profiles by eLung
(
From
[
47
])
Aptar Pharma (Le Vaudreuil, France) also recently reported feasibility studies
for the FSI detailing its use for the measurement of another DPI (Prohaler™),
featuring their proprietary OBIC™ (open, breathe-in, close) technology [
48
]. The
objectives of their study were to look at several aspects of impaction testing
comprising:
1. The performance of the FSI versus the NGI
2. The effect of coating the collection surface of the insert in the FSI
3. The comparison of emitted dose data from the FSI versus a dose unit sampling
apparatus (DUSA)—standard equipment recommended by the regulators for the
measurement of delivered dose uniformity
4. A comparison of testing parameters for the NGI and FSI
5. Estimation of time and cost advantages of FSI testing versus NGI testing
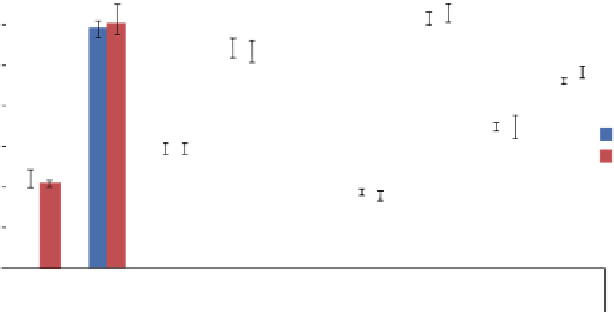
Comparative tests were carried out at a flow rate of 35 L/min with a 2 L sample
volume using the FSI equipped with a 5
m stage cut-off and an NGI, with three
actuations of the device in each case. With three actuations of the DPI the FSI deter-
mined slightly higher values of both total emitted dose (equivalent to
TEM
) and fine
particle dose <5
μ
m (equivalent to
FPM
<5μm
) than did the NGI (Fig.
10.50
).
Mean values of
TEM
and
FPM
<5.0μm
with a single actuation of the DPI were both
around 10% (
TEM
) to 30% (
FPM
<5.0μm
) higher by FSI compared with the corre-
sponding data from the NGI. However, the 3-dose data for the FSI were in much
closer agreement with the corresponding benchmark NGI metrics, being only 1%
(
TEM
) and 15% (
FPM
<5.0μm
) higher than the corresponding NGI values. It was
hypothesized that the observed differences were due to increased particle bounce
and entrainment when single doses were measured, but collection surface coating
μ


Search WWH ::

Custom Search