Biomedical Engineering Reference
In-Depth Information
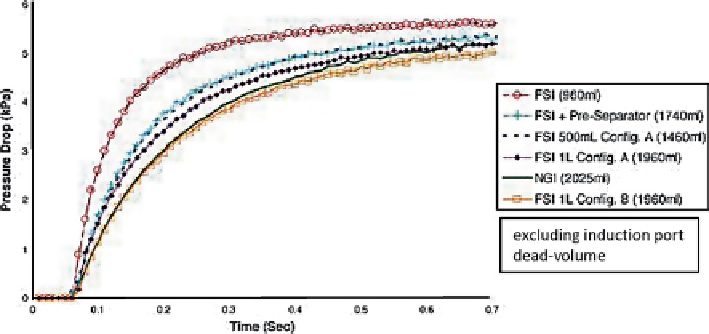
Fig. 10.40
Pressure drop profiles at a nominal flow rate of 60 L/min for DPI product 1 evaluated
by Pantelides et al. (
From
[
42
]—
used with permission
)
allowed a gradual flow expansion on start-up created a FSI-generated pressure drop
profile that closely matched that of the NGI. In contrast, when Configuration A that
permitted rapid flow expansion was used with the same 1 L volume, the FSI-generated
pressure drop profile was observably steeper, reflecting an increased pressure ramp
rate, but not as steep as that for the FSI without any added dead volume.
This study showed that if the FSI is equipped with a standard NGI pre-separator
(780 mL [
41
]) before the fine-cut stage, the pressure drop profile was closer to that
for the NGI, suggesting that this simple modification to the FSI may be all that is
required to achieve comparability for the fluid dynamics for the two systems.
However, there was still a significant difference in the pressure drop values (around
1 kPa at about 0.25 s), and this disparity may have been the cause of the significantly
higher FPF% shown in Fig.
10.40
for the combined system.
Pantelides et al
.
completed the investigation by comparing
FPM
<5.0μm
per actuation
obtained by all the various FSI configurations with reference data (full APSD) obtained
for DPI product 1 by the NGI (Fig.
10.41
). Increasing the volume of the FSI reduced the
magnitude of fine particle mass closer to the value interpolated from the reference APSD.
However, dead volume shape and flow resistance of the measurement system [
44
] likely
also had an influence. Thus fine particle mass obtained with the 1-L “Configuration B”
added to the FSI was closer to the reference NGI value than the corresponding measure
obtained by the FSI when “Configuration A” was used, also adding 1 L to the internal
volume of the system. Importantly, such behavior would have been predicted from the
relative positions of the pressure drop-elapsed time profiles in Fig.
10.40
. These valida-
tion measurements added further confirmation that despite the pressure differences men-
tioned above, the addition of the NGI pre-separator to the FSI improves the correlation
between this apparatus and the NGI in terms of fine particle mass.
The small discrepancy in the data shown in Fig.
10.41
between the FSI with pre-
separator and NGI was the subject of a follow-on study in which the internal volume
of the FSI was augmented to 1,740 mL by the arrangement shown in Fig.
10.42
[
45
].
Search WWH ::

Custom Search