Biomedical Engineering Reference
In-Depth Information
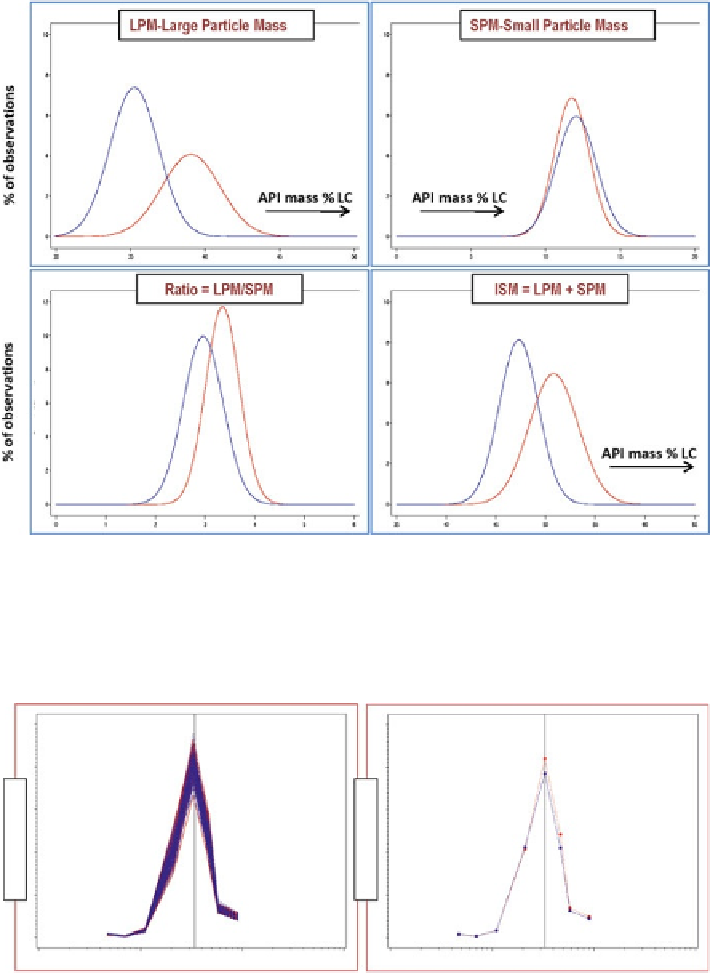
Fig. 9.24
Intentional design change to OIP aerosol assessed by EDA
Individual Profiles
Mean Profiles
25
25
20
20
15
15
10
10
5
5
0
0
0.1
1.0
10.0
100.0
0.1
1.0
10.0
100.0
Aerodynamic diameter (
m
m)
Fig. 9.25
Multistage CI-measured APSD profi les for product C; the
blue lines
represent the origi-
nal design, and the
red lines
were obtained from the modifi ed design to the OIP
Search WWH ::

Custom Search