Biomedical Engineering Reference
In-Depth Information
Table 9.5
Comparison between EDA and stage groupings approach to the assessment of
CI-measured data fro
m a solution-formulated MDI (
from
[
9
]
—used by permission
)
Correlation (
R
2
values) between mass deposition by stage grouping,
MMAD
and
LPM/SPM
MMAD
(
d
50
(
μ
m)
μ
m)
Group 2
Group 3
Group 4
0.83
0.98
0.7814
0.0655
0.7023
1.36
0.92
0.8488
0.0348
0.6057
2.30
0.84
0.8623
0.0155
0.5418
3.99
0.86
0.9027
0.0110
0.5454
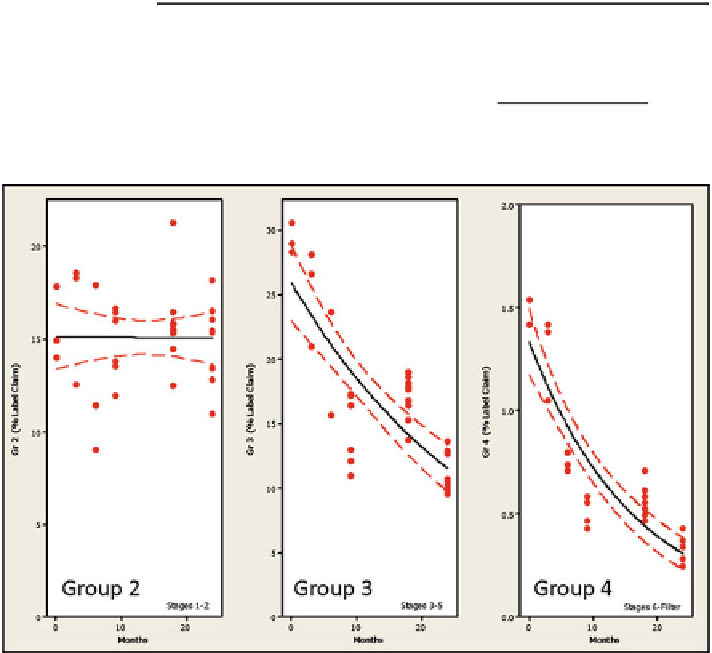
Fig. 9.17
OIP product “A”APSD changes in 24-month stability trial assessed by CI stage
groupings
EDA was also able to detect the trend as a time-dependent increase in
LPM/SPM
(Fig.
9.19
). However, the corresponding decrease in
ISM
pointing to a change in
mass entering the CI from the OIP would not have been as obvious if viewed either
from variations in individual stage groupings or
FPM
.
In the case of product B, stability trending was observed with all three groupings
(Fig.
9.20
); the shift to larger values for stage 2 is accompanied by decreases in both
groups 3 and 4 pointing to an overall APSD movement towards larger sized particles.
This shift in APSD was also detected by a trend towards decreased values of
FPM
with time (Fig.
9.21
).


Search WWH ::

Custom Search