Biomedical Engineering Reference
In-Depth Information
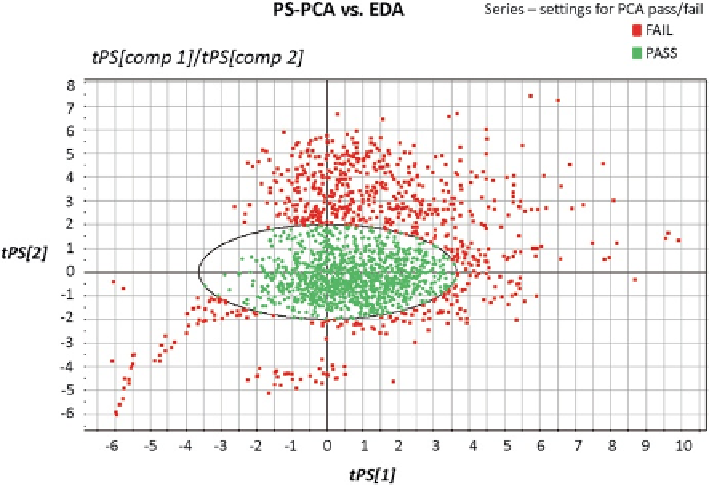
Fig. 8.66
PCA scores plot of full data set;
tPS[1]
and
tPS[2]
are predicted principal component
scores (1 and 2) derived from overlaying the data onto the PCA model established using the 252
clinical measurements
to build the model, whereas a profile colored as “fail” means that the full-stage
APSD profile is not similar to the 252 APSD profiles used to build the model.
The scores plot with this coloration applied is shown in Fig.
8.66
. Of the 1,738
measurements, 934 fell within the Hotelling
T
2
0.99 confidence limit of the clinically
relevant data set and could therefore be considered as “passing,” while 804 fell
outside and could therefore be considered as “failing.”
Next, EDA and grouped-stage approaches were evaluated using the same data
set, and the data generated by each was cross-referred to the scores plot for the full-
resolution NGI data.
8.5.3.2
Results for EDA Metric
LPM
/
SPM
LPM
/
SPM
ratio versus
MMAD
was compared using the same data set described in
the previous section. This plot was therefore based on the 252 clinically relevant CI
APSD profiles that formed the training data set of the PCA model. The
MMAD
was,
again, estimated from a logistic curve fit as described in Sect.
8.4.1
, in connection
with data preparation for MSA. Here, the
LPM
consisted of the sum of the material
deposited on S1-S3 of the NGI, and the
SPM
consisted of the sum of material
Search WWH ::

Custom Search