Biomedical Engineering Reference
In-Depth Information
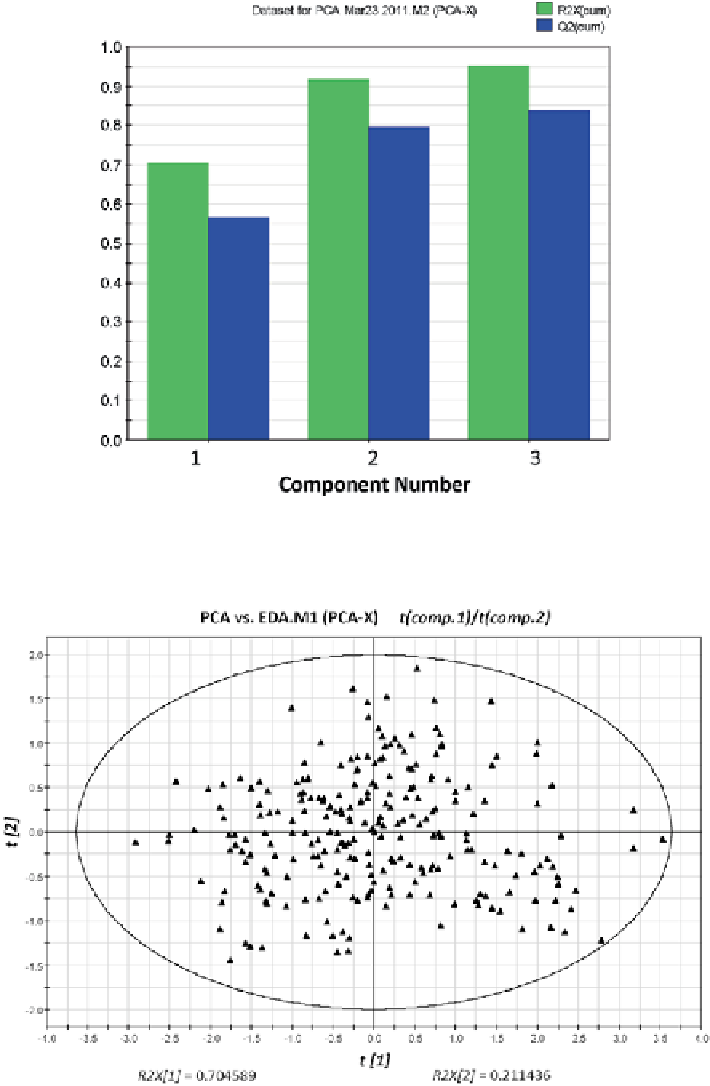
Fig. 8.63
PCA model overview: plot of the proportion of variation either explained [
R
2
X
(
cum
)]
or predicted [
Q
2
(
cum
)] as a function of the number of components in the PCA model
Fig. 8.64
Scores plot of clinically relevant measurements of APSD based on the 252 NGI mea-
surements of a real (blinded) OIP
Search WWH ::

Custom Search