Biomedical Engineering Reference
In-Depth Information
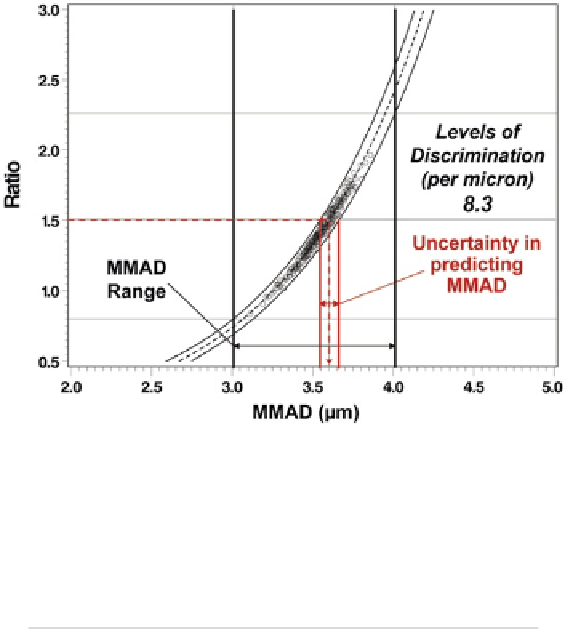
Fig. 8.55
Plot illustrating the ability of
LPM
/
SPM
ratio to predict
MMAD
; the width of the range
of acceptable
MMAD
values is approximately eight times larger than the uncertainty interval of the
prediction, indicating a relatively high capability to discriminate different values of
MMAD
with
the acceptance limits
Table 8.10
IPAC-RS database file codes for OCC assessment process
Figure(s) depicting
OCC assessment
File code
OIP type
w9k001
CFC suspension MDI
8.49-8.53
w9j601
CFC suspension MDI
8.56
w9j801
HFA solution MDI
8.57
w9j901
HFA suspension MDI
8.58
w9jk01
DPI
8.59
w9k201
HFA suspension MDI
8.60
w9k901
DPI
8.61
w9kw01
CFC suspension MDI
8.62
43 and 39 CI data sets, respectively. The techniques used for expanding the range of
APSD shifts also allowed for potential changes in
ISM
that could be expected to
occur due to physical mechanisms associated with APSD shifts in OIPs. In some
cases shifts in APSD were accompanied by an increase or decrease in the mass of
API entering the size-fractionating CI stages contributing to
ISM
, resulting in a
corresponding increase or decrease in this metric.
These assessments show that when
ISM
is included, the decision-making process
can detect changes in the amount (mass of API) as well as the shape of the APSD.
The OC curve plots show instances of correct rejection, due to unacceptable
ISM
,
even when the
MMAD
was still within an acceptable range. This is evident in the
black plot symbols (indicating a correct decision), within the acceptable range of
MMAD
, but outside the acceptable range for grouped stages or ratio. Assessments
presented in Figs.
8.56
,
8.57
,
8.58
,
8.59
,
8.60
,
8.61
, and
8.62
show results consistent

Search WWH ::

Custom Search