Biomedical Engineering Reference
In-Depth Information
Table 8.9
Simulation results for various scenarios showing type I and type II error rates for the
two approaches and the relative type I error rates for grouped stages compared to EDA; results
from groups 2-4 are combined to yield the overall grouped-stage decision (i.e., if any of the groups
2-4 fails, the overall decision fails)
Error rates
Relative type I
error rates:
grouped stages
versus EDA
Grouping
distribution
percentiles
Prediction
interval
(%)
LPM
/
SPM
ratio
Grouped stages
Type I
Type II
Type I
Type II
10, 90
95
6.57
0.03
22.82
0
3.47
99
10.86
0.01
30.51
0
2.81
99.9
17.01
0.01
41.82
0
2.46
5, 95
95
8.48
0.04
23.08
0
2.72
99
13.89
0.01
32.39
0
2.33
99.9
19.66
0.01
43.09
0
2.19
1, 99
90
9.61
0.09
20.95
0.09
2.18
95
12.24
0.08
26.05
0.02
2.13
99
17.38
0.05
39.03
0
2.25
99.9
20.81
0.02
48.04
0
2.31
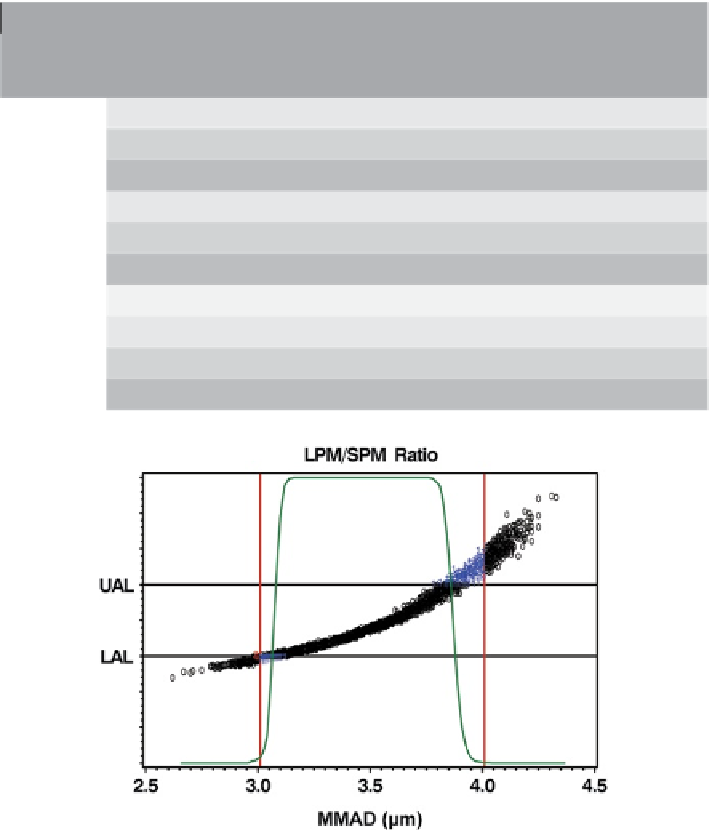
Fig. 8.49
OIP product
w9k001
: OC curve (
solid green line
) and results for
LPM
/
SPM
ratio;
black
symbols
are correct decisions,
blue symbols
are false rejections (type I errors),
red symbols
are
false acceptance (type II errors). LAL and UAL are lower and upper acceptance limits,
respectively
In addition to the relative rates of false rejections and false acceptances, the
pattern of incorrect decisions is also important in assessing the decision-making
capability of a method. If the errors are near acceptance limits, but a method is
clearly discriminating in the majority of acceptable and unacceptable regions, that
method could be considered more useful in making correct decisions than the one


Search WWH ::

Custom Search