Biomedical Engineering Reference
In-Depth Information
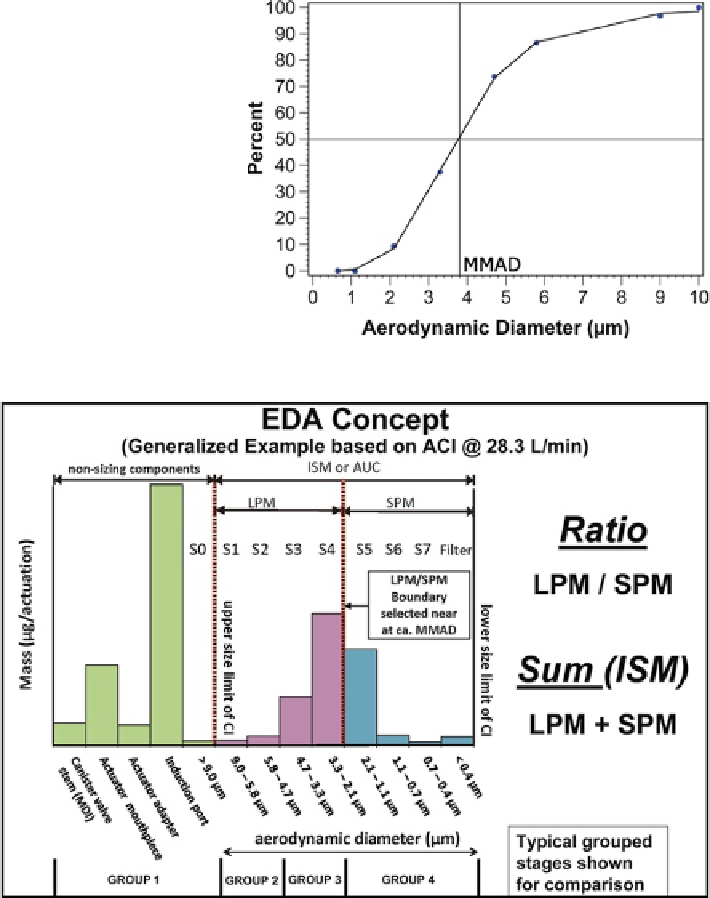
Fig. 8.39
MMAD
calculated
for each APSD using a
4-parameter logistic curve fit
as shown in Fig.
7.4
Fig. 8.40
Representative APSD histogram and corresponding EDA and grouped-stage metrics
chosen by Christopher-Dey
outcome of the grouped stages predicts
MMAD
. Similarly, the ability of the EDA
approach to make the correct decision is directly related to the ability of the ratio
metric to predict the value of
MMAD
.
In the context of hypothesis testing, the null hypothesis presented here is that a
characteristic of the CI data,
MMAD
(analogous to a population mean), lies within
Search WWH ::

Custom Search