Biomedical Engineering Reference
In-Depth Information
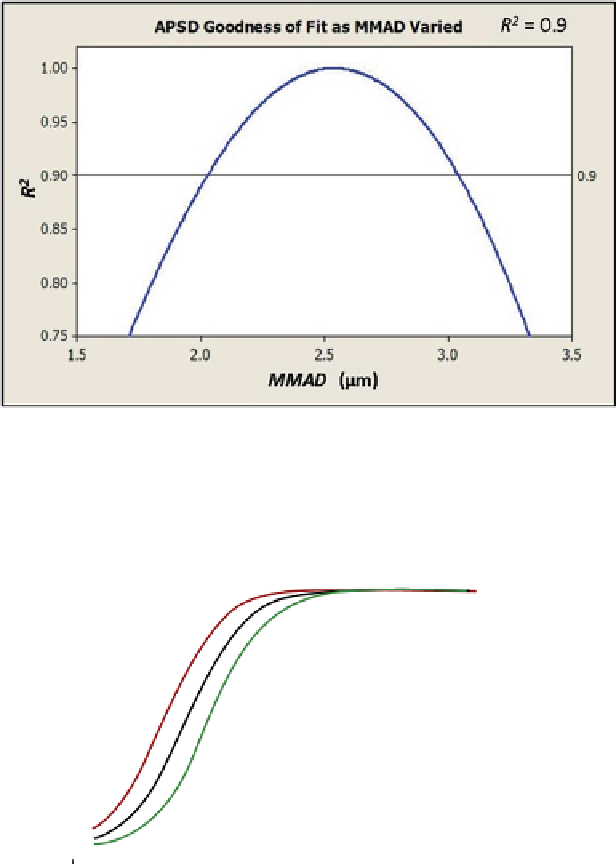
Fig. 8.24
Process for establishing assumed limits for construction of OCCs: the limit is defined
by the value of
MMAD
corresponding to the intersection of the selected
R
2
value (in this case 0.9)
and the goodness-of-fit curve
Comparison of Ideal APSD vs Limiting Quality Cases
50
Variable
Norm
Lower
Upper
40
R
2
=0.9
30
20
10
0
0123
Aerodynamic diameter (
m
m)
456789
Fig. 8.25
Cumulative mass-weighted APSDs for OIP product
w9j601
illustrating target and limit-
ing APSDs derived with
R
2
set at 0.9
Corresponding and equivalent limits for the metrics of interest in the context of
EDA and “stage groupings” could be established primarily from these limiting
cumulative APSDs, once the limits were established in terms of
MMAD
and the cor-
responding extreme cumulative APSDs were computed. Figure
8.27
tracks the ideal


Search WWH ::

Custom Search