Biomedical Engineering Reference
In-Depth Information
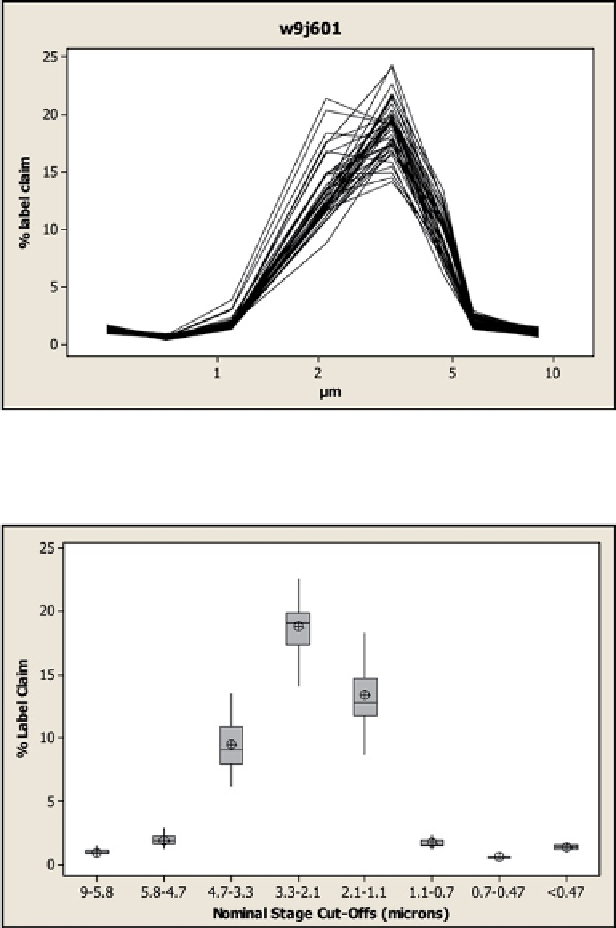
Fig. 8.21
Superimposed CI-measured APSDs for CFC suspension MDI (
w9j601
) from the
IPAC-RS database
Fig. 8.22
Stage-by-stage box plots of CI results for CFC suspension MDI
w9j601
; the
encircled
“plus” signs represent the stage mean values for all
n
= 43 results
logistic sigmoidal model to the cumulative APSD. Figures
8.22
and
8.23
illustrate
the outcomes for product
w9j601
.
Limits were established by first constructing a goodness-of-fit statistic based on the
concept of a coefficient of determination (
R
2
). The target APSD was displaced by its
Search WWH ::

Custom Search