Biomedical Engineering Reference
In-Depth Information
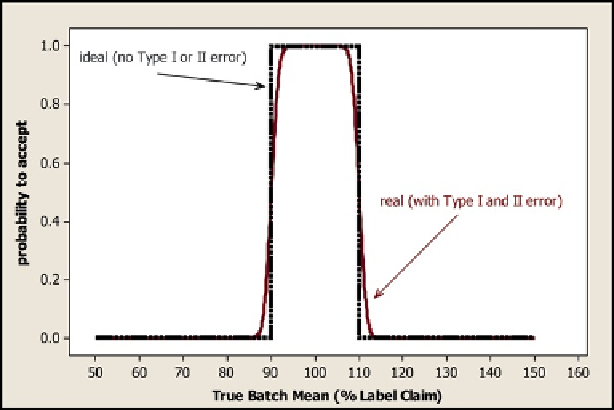
Fig. 8.5
Comparison of an ideal step function (
dashed black
) versus a real (
solid red
) OCC for a
two-sided limit
remain essentially zero. Likewise, for batches where the true assay was well within
the 90-110% critical values, the probability for acceptance would be essentially
unity. However, as the true assay approaches the critical values of 90% or 110%, the
impact of indeterminate measurement error would be to cause deviation from the
ideal step function such that there would be some finite probability of accepting a
batch with a true assay slightly below 90% or slightly above 110% and, conversely,
a finite probability of rejecting a batch that had an assay slightly above 90% or
slightly below 110%. This is illustrated in Fig.
8.5
. The uncertainty of the mean
estimate due to the finite sample size (i.e., less than 100% inspection) in this exam-
ple will work in the same way as the analytical measurement uncertainty.
The example described above employed a two-sided limit, i.e., an upper and
lower bound. There are many examples of one-sided limits, where the quality attri-
bute (in some specified representation, e.g., as a sample average, or a batch mean
estimate, or individual measurements in a sample) is required to be either below an
upper bound or above the lower bound. An example of the former might be an upper
limit on moisture content or the level of an impurity. An example of the latter might
be a minimum allowable level for an antioxidant. The same principles apply to the
one-sided case as two-sided cases, although the shapes of the OCCs will change.
Examples of ideal and real one-sided OCC are illustrated in Fig.
8.6
.
The general interpretation of OCCs is that the closer the OCC is to the ideal step
function, the better the decision-making process, i.e., better discrimination among
batches, particularly those close to the limits. OCCs provide information about type
I (false rejection) and II (false acceptance) error rates as a function of the true value
of the quality attribute under consideration. This is also illustrated in Fig.
8.6
.
Search WWH ::

Custom Search