Biomedical Engineering Reference
In-Depth Information
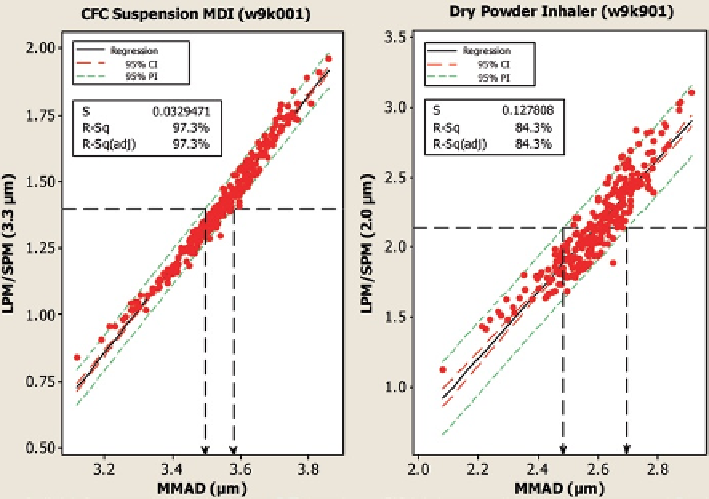
Fig. 7.9
Example regression plots for
LPM
/
SPM
ratio versus
MMAD
(
From
[
11
]—
used with
permission
)
few tenths of a micron are easily detected. Note that the value of the goodness-of-fit
statistic
RMSE/b
is directly proportional to the difference between the projected
prediction bounds at the mean
LPM
/
SPM
ratio by a factor related to the selected
confidence level.
While both goodness-of-fit statistics (
R
2
and
RMSE/b
) are in general agreement
about the quality of the correlation between
LPM
/
SPM
ratio and
MMAD
, they do
not rank order the products in exactly the same way. Note, for example, that the two
DPIs (
w9jk01
and
w9k901
) have the lowest values of
R
2
yet the corresponding
RMSE/b
values are in the middle of the range of results at 0.047 and 0.054 μm,
versus an overall range from 0.020 to 0.071 μm. This apparent discrepancy arises
primarily from the survey nature of this study and the inherent characteristics of the
particular products included. Individual
MMAD
values from these two products
exhibited two of the three smallest variations in
MMAD
(interquartile range from
0.133 to 0.159 μm) among all eight products (total range of the interquartile ranges
is from 0.133 to 0.444 μm). A smaller range of
MMAD
values results in more uncer-
tainty in the estimation of the regression parameters and hence poorer
R
2
values for
a given
RMSE
. Conversely a better
R
2
would result for a wider range of
MMAD
values with a similar
RMSE
. Thus, at a given level of
RMSE
, the value of
R
2
is a
function of the range of values in the dataset. In contrast, the
RMSE/b
statistic is a
measure of the uncertainty in estimated
MMAD
values at the mean
LPM
/
SPM
of the
Search WWH ::

Custom Search