Agriculture Reference
In-Depth Information
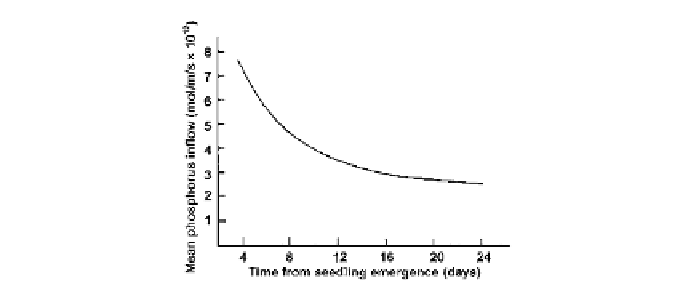
Fig. 6.1.
The mean phosphorus (phosphate) inflow (uptake per unit length) into the
roots of onion seedlings during the early stages of growth in near-optimal
conditions in a soil of moderate P status (soil C of Brewster
et al
. (1975) with
solution phosphate concentration 0.0325 mol/m
3
).
The pattern of total nutrient uptake of a bulb onion crop is shown in Fig.
6.2b. It is clear from Fig. 6.2b that around 70% of N and P uptake and growth
in dry weight occurred during the final half of the overall growth period. In
Swedish conditions, about 80% of N uptake took place in the final third of the
growth period (see Fig. 6.4). To achieve high yield it is essential to supply
sufficient N to satisfy the high demand at this stage when bulbs are bulking-up.
Figure 6.2c shows a decline in the percentage of mineral nutrients in an onion
crop dry matter with time. The percentage mineral nutrient content of most crops
declines as crop weight per unit area increases. This can be explained by the
concentrations of N, P and K being higher in metabolically active tissue than in
structural and storage tissue. A certain minimum concentration (percentage of a
dry weight) of a mineral nutrient occurs in live, non-growing plants. Above this
minimum, relative growth rate (RGR) increases with percentage nutrient in the
dry matter up to a critical percentage that can be seven- or eightfold the minimum
level, provided other nutrients are non-limiting (Agren, 1988).
Relative growth rate increases linearly with percentage N in this range and
quadratically with percentage P (Agren, 2004). As crop mass per unit area
increases, the proportion of non-growing structural and storage tissues
increases, and therefore RGR declines and the concentrations of nutrients per
unit of total dry weight required to keep growth rates near maximal (termed
the 'critical nutrient concentrations') decline (Greenwood
et al.
, 1991). The
relationship between the critical percentage N and crop weight per unit area
found in N fertilizer trials with onions was fairly well described by an equation
common to many C
3
plants (see Fig. 6.3a), although at low weights the data for
onion fall below this line, possibly because it has an inherently low RGR and
therefore a lower critical N requirement than faster-growing crops.