Agriculture Reference
In-Depth Information
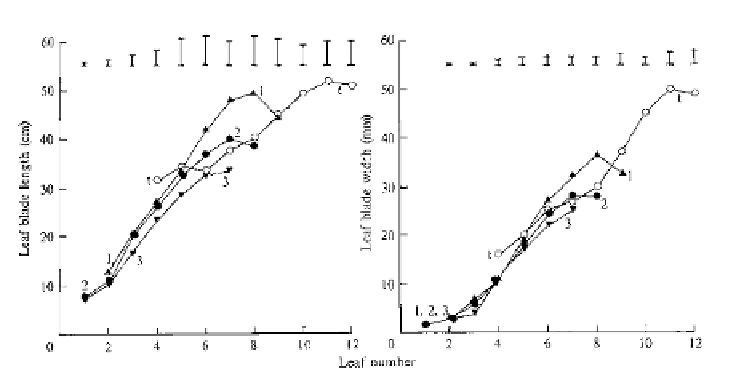
The rate of ligule appearance (which indicates full expansion of a leaf
blade) was slower than leaf tip appearance, showing that the duration of leaf
expansion progressively increases for the first eight to ten leaves. As a
consequence, in cv. 'Autumn Mammoth', each leaf was about 6 cm longer than
its predecessor, and also about 0.45 cm wider (see Fig. 4.49). Cultivars differ in
rate of leaf initiation, appearance and elongation per degree-day. Also, these
rates tend to be higher in bright, sunny years than in dull seasons, suggesting
a possible influence of light as well as temperature on these relationships. This
would not be surprising, since the growth rate of leek seedlings is more
sensitive to daily light income than are other crops (see below).
The growth in weight of leek seedlings has been shown to be well modelled
by Eqn 4.18. The constant p in this equation is the relative growth rate per
'effective day-degree' (EDD). Effective day-degrees are day-degrees above the
base temperature, T
B
, modified by an effect of daily photosynthetic radiation
income, R, using the constant f (Scaife
et al.
, 1987) (see Eqn 4.19b). Leek cv.
'Winterreuzen' has values of T
B
= 5.9°C, p = 0.015/EDD and f = 0.146
MJ/m
2
/DD. The f value is higher than for any of nine other crops studied, the
base temperature for growth T
B
is typical of many temperate vegetable species
and p is low compared with other species (Brewster and Sutherland, 1993).
The latter indicates an intrinsically low potential growth rate.
Hence leeks need a long growing season to produce plants of marketable
size given their small seedling weight at emergence (about 0.002 g dry weight).
The high value of f shows leek seedling growth rate to be particularly sensitive
to daily light income. Probably the narrow, upright leaf habit, which is ill-
Fig. 4.49.
The dimensions of fully expanded leaf blades of leek plants cv. 'Autumn
Mammoth' from three spring sowings (1, 2, 3) and one transplanting (t) in the same
season in Scotland. The vertical bars indicate standard errors of means x 2 (from
Hay and Brown, 1988. Courtesy of
Annals of Applied Biology
).