Information Technology Reference
In-Depth Information
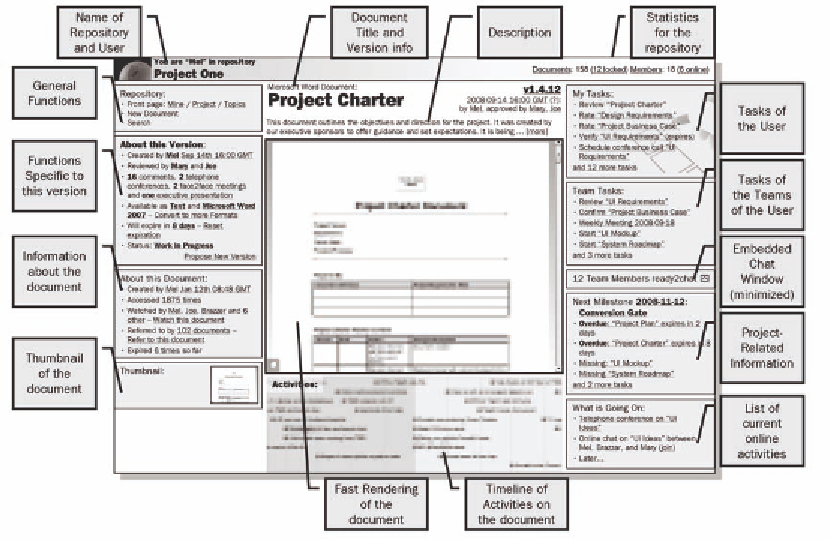
Figure 4. The “Document” system
document,
what activities the user performed, and
the repository. Targets would be tricky to set, but
there is a minimum threshold of activity below
which measures need to be taken.
This information needs to be
visible to the
user
, to prevent it from becoming a bogeyman or
a source of feeling betrayed. A good tool to show
all the interactions is a graphical timeline, very
much like the one used by the SIMILE project.
Using AJAX, the client device can assemble the
timeline rather than the server. As a result, the
download of information will be much faster and
the resulting “widget” of information much more
interactive than a simple image. The system can
display versioning and other advanced features
in a user-friendly manner. See the mockup screen
(Figure 5).
For all users,
a list of their most active docu-
ments
should also be available. Here is a list of the
reports possibly displayed on the user's activity
profile screen:
•
•
where the user went after interacting with
the document.
This data should be captured in addition to the
times and durations for editing the document. All
this information will add greatly to the understand-
ing of the flow of activities and the importance
of the document to users.
The system should aggregate the information
from both the documents and the user's viewpoint.
For
management purposes
, the user's listening
activities are now much more transparent, as we
can now see how many times he used search,
how often he looked at the repository, and how
long it took him to interact with a document. The
reporting either should occur anonymously or
named, based on the company's culture. In the
case of anonymity, management will at least have
an idea of how much time is spent actually using
Search WWH ::

Custom Search