Information Technology Reference
In-Depth Information
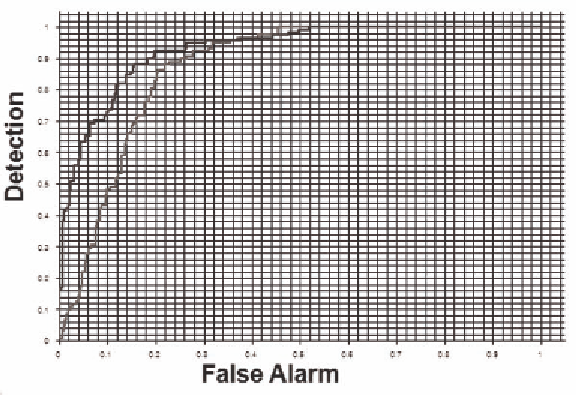
Figure 3. ROC curves of the training data set (the upper curve) and the testing data set (the lower
curve)
method is to use a machine learning approach, that
is, to see if the predictive variables extracted and
their parameters estimated from one set of data
and then apply the result to another set of data.
We randomly divided the wiki pages into two
data sets, each set consists of half of the high
quality pages and half of the ordinary wiki pages,
then used one set (we call it the training data set)
to estimate the parameters of the logistic regres-
sion equation, and applied the result to predict the
quality of the wiki pages in the second set (we call
it the testing data set). In the following section,
we report the result of this application.
ing ordinary pages as high quality pages as “false
alarm”, we can plot a ROC (Receiver Operating
Characteristic, see Egan 1975 and Swets 1996)
curve by sorting the odd of being a high quality
page for each and every wiki page in the testing
data set. The odd was calculated using the stepwise
logistic regression equation constructed from the
testing data set.
In Figure 3, the upper curve is from the training
data set and the lower curve is from the testing
data set. Every point along the curves represents a
possible cutoff point to discriminate between high
quality pages and ordinary pages. The associated
detection rate of a point is the ratio of the number
of high quality pages that would be correctly
classified using that point as a cutoff to the total
number of high quality pages in the testing data
set. The associated false alarm rate of a point is the
ratio of the number of ordinary pages that would
be incorrectly classified as high quality pages
using that point as a cutoff to the total number of
ordinary pages in the testing data set.
As we can see from the graph, the predictive
power of the ROC curves are pretty good. When
detection rate of the training data set is as high as
receiver operating
Characteristic (roC) Curve
ROC (receiver operating characteristic) curve is
a tool from signal detection theory (Egan 1975,
Swets 1996). It is a graphical plot for a binary
classifier system as its discrimination threshold
is varied. It shows the chance of correct detection
as a function of the number of false alarms.
If we consider classifying high quality pages
correctly as “detection” and incorrectly classify-
Search WWH ::

Custom Search